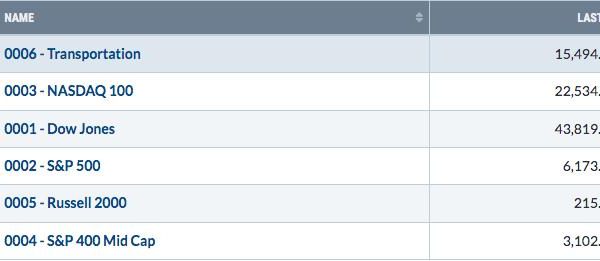
It’s just like the entire month of May, when folks were saying “Sell in May and go away”– but not us. We were telling you that the Big View Risk Gauges were all pointing to risk on.
However, before that, on March 12, 2023, we also saw the now confirmed island bottom in the long bonds (TLT). The title of that Daily, “Long Bonds: Island Bottom and the Signal of Chaos“, represented the Regional Bank debacle, now well in our rearview mirror. Nonetheless, we imagined then that, should 20+ year bonds continue to go north, that too could be inflationary.
We started the year introducing our report How to Grow Your Wealth in 2023. In this Year of the Yin Water Rabbit, we began with:
You Can’t Run with the Hare and Hunt with the Hounds.
One thing we do know is that, while risk on prevails, anything this year can change and change quickly. That IS the nature of Stagflation.
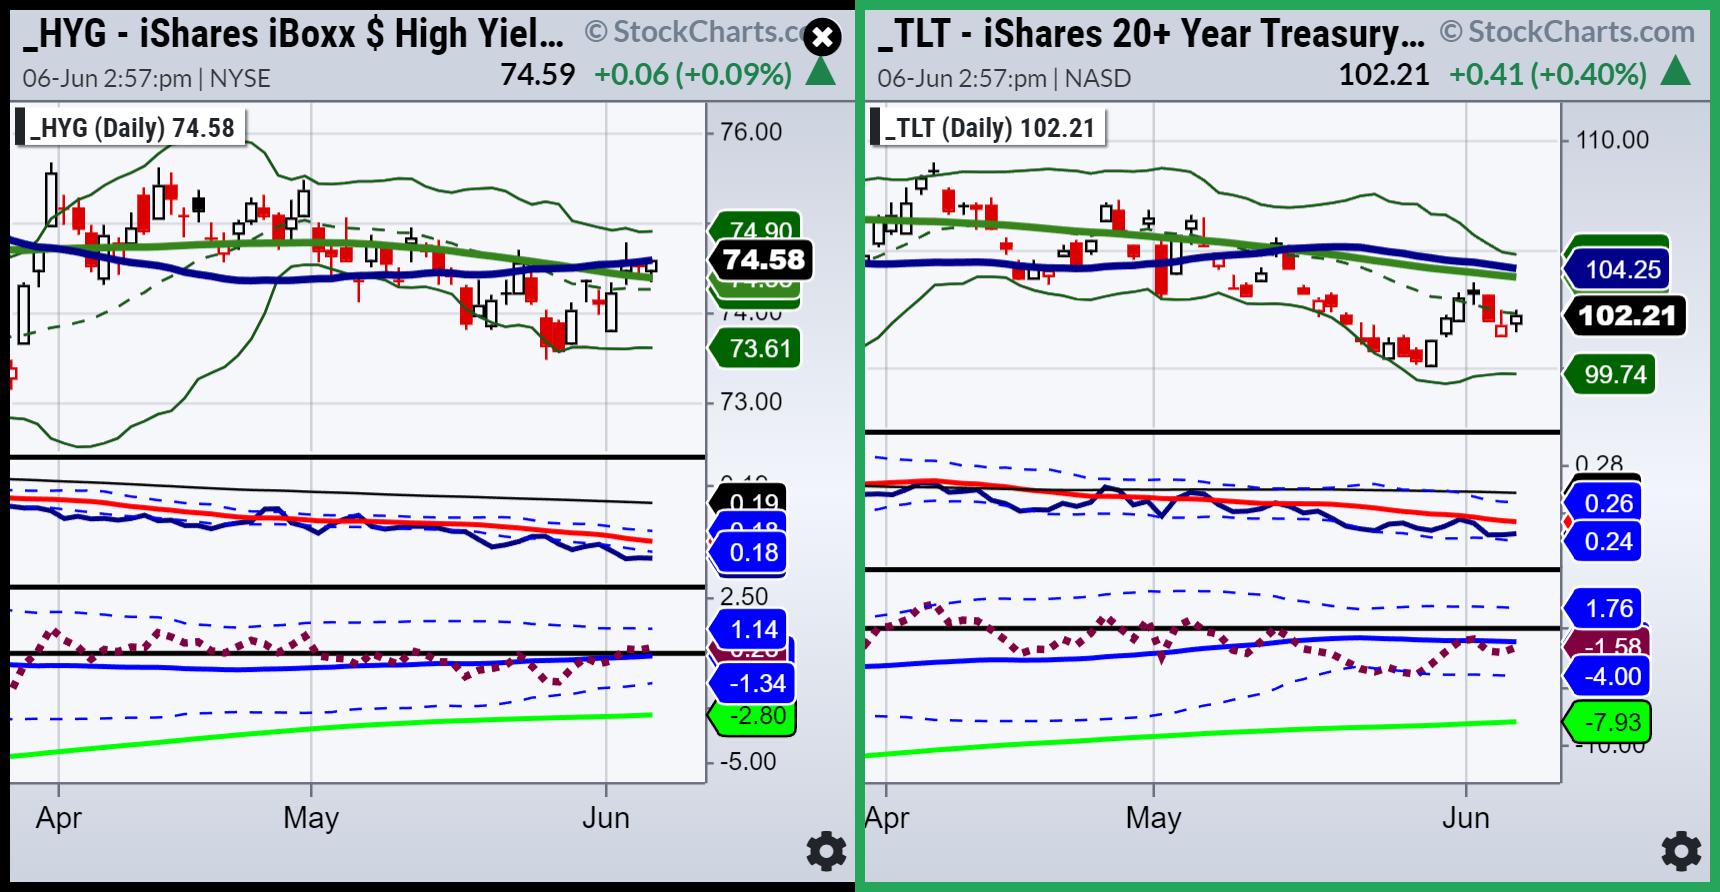
The chart of both the long and junk bonds tells us that, currently, junk outperforms. So, bulls, we are okay. Our job is to keep you one step ahead to prepare your portfolio before it’s too late, which, we assume by now you have learned, needs to be active rather than passive.
We found it curious, though, that, with indices all up June 6th, the TLTs also went green. Maybe premature, maybe nothing–but at least now, you are paying attention. Should we get an up day in TLT and a down day in HYG, that can be a great alert.
The dollar has been strong. The UUP ETF shows price above the 200-DMA (green). Our Real Motion Indicator tells us the dollar remains in a mean reversion sell signal. Hence, watch for continuing weakness.
The gold chart (GLD ETF) is in a caution phase. Many are getting negative gold. Not us. We see a buy mean reversion signal on our Real Motion.
Gold has done a great job holding $1950 in futures. Now over $2000, which should correspond with 185 in GLD, things can get interesting. And speaking of commodities, the grains, softs and industrial metals are looking a lot better.
For more detailed trading information about our blended models, tools and trader education courses, contact Rob Quinn, our Chief Strategy Consultant, to learn more.
“I grew my money tree and so can you!” – Mish Schneider
Get your copy of Plant Your Money Tree: A Guide to Growing Your Wealth and a special bonus here.
Follow Mish on Twitter @marketminute for stock picks and more. Follow Mish on Instagram (mishschneider) for daily morning videos. To see updated media clips, click here.
Mish in the Media
Mish joins Rajeev Suri of Orios Venture partners to discuss the Fed, inflation, and buybacks in this video on LinkedIn.
In this episode of StockCharts TV’s ChartChats, Mish Schneider and TG Watkins (creator of the Moxie Indicator) sit down for a candid chat about working with other StockCharts contributors. Learn what TGs strategy for trading is, and how the the Moxie Indicator came to be. Mish shares her background and how she got started in the industry.
With Congress having reached a deal after months of debt ceiling talks, what direction could the US dollar move in, and what could this mean for the USD/JPY? Mish explores the market movements in this appearance on CMC Markets.
Mish joins Rajeev Suri of Orios Venture partners to discuss the trend toward a risk-on situation in this video on LinkedIn.
Mish weighs in on the overnight slump across the board on the benchmarks and where the momentum is heading on Singapore Breakfast, available on Spotify.
Mish explains how reversal patterns could come to the fore this week in this appearance on CMC Markets.
Mish joins Rajeev Suri of Orios Venture partners to discuss the possibility of economic stagflation in this video on LinkedIn.
Mish discusses how AI is being used to invest in this article for BNN Bloomberg.
Mish joins Rajeev Suri of Orios Venture Partners to discuss the implications of the debt ceiling deal in this video on LinkedIn.
Mish discusses the commodities to watch in this video from CMC Markets.
In this appearance on Business First AM, Mish covers business cycles, plus where to go for trades once the dust settles.
Mish and Caroline discuss profits and risks in a time where certain sectors are attractive investments on TD Ameritrade.
Powell eyes a pause, Yellen hints at the need for more rate hikes, and debt ceiling talks face challenges… what a way to end the week, as Mish discusses on Real Vision’s Daily Briefing for May 19th.
Mish walks you through the fundamentals and technical analysis legitimizing a meme stock on Business First AM.
Coming Up:
June 7-8: Mario Nawfal Twitter Spaces, 8am ET
June 8: Wolf Financial Spaces
June 9: BNN Bloomberg Opening Bell
June 22: Forex Premarket Show with Dale Pinkert
June 23:Your Daily Five on StockCharts TV
ETF Summary
S&P 500 (SPY): August 2022 high 431.73, and of course 420 now key.Russell 2000 (IWM): 180 now must hold while still miles from its 23-month MA 193.Dow (DIA): 23-month MA, 337 pivotal.Nasdaq (QQQ): 370 resistance, 350 now closest support.Regional banks (KRE): 42.00 pivotal.Semiconductors (SMH): 142.50 the 10-DMA held on this correction so far.Transportation (IYT): 230 level is key.Biotechnology (IBB): 121-135 range.Retail (XRT): Granny cleared 60; rotation to value and beat up discretionary is a good sign.
Mish Schneider
MarketGauge.com
Director of Trading Research and Education


