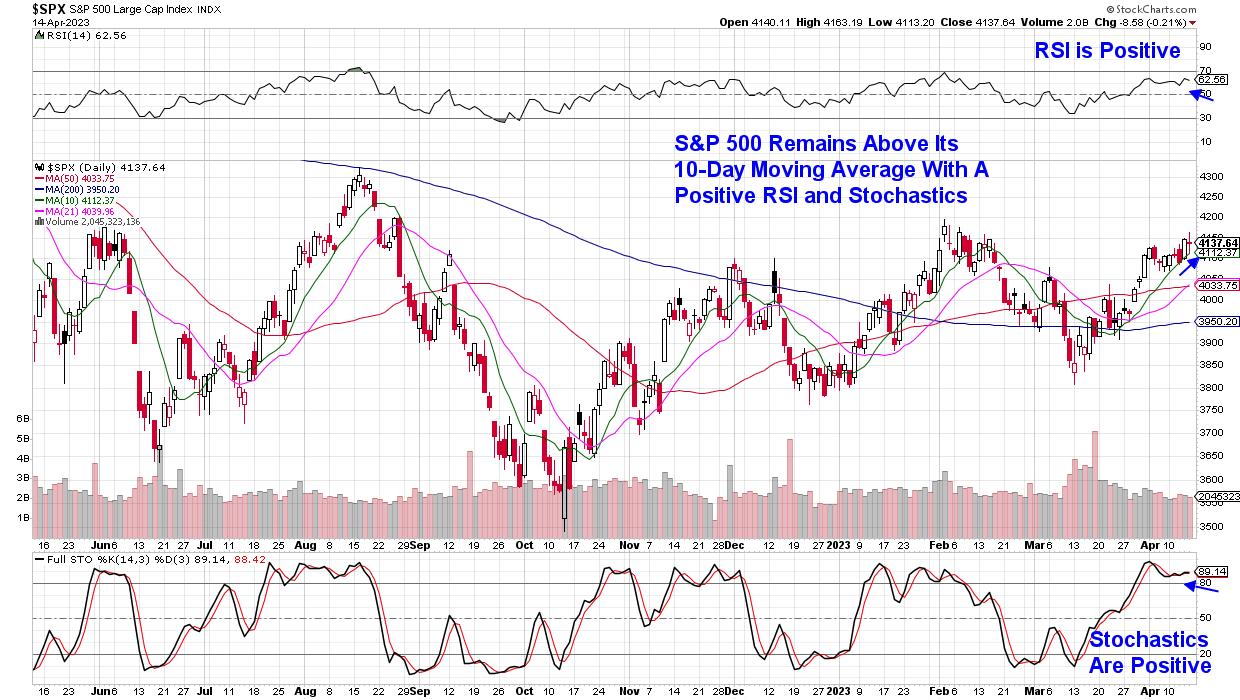
The stock market remains in an uptrend after modest gains for the week, which occurred amid signs that the economy is slowing down while inflation is cooling. It was a period marked by large intraday moves, however, as investors digested news that Fed officials are anticipating a mild recession later this year. Also, data last week showed that, while inflation is slowing, it remains at a highly elevated level, which may lead to more rate hikes.
DAILY CHART OF S&P 500 INDEX
Fed rate hikes in the face of a possible recession is not a great backdrop for the markets, and last week’s underperformance in the Technology sector underscored investors’ concern. These high growth stocks are particularly vulnerable to higher rates and fears of a slowing economy.
At this time, investing in companies that are growing and that also fare well despite a potential slowdown in the economy would be a great way to participate in the current uptrend. Focusing on stocks that are also breaking out of a sound base would be ideal, as this chart pattern often precedes further upside price action. Below is a prime example of a recession-proof company that broke out of a base last month amid an improved growth outlook.
MCDONALD’S CORP. (MCD)
Subscribers to my MEM Edge Report are quite familiar with McDonald’s (MCD), as we added the stock to our select list of Suggested Holdings in late March after its base breakout on above-average volume. MCD’s affordable menu, coupled with their operating margins improving more than Microsoft (MSFT) and other tech companies, had Wall Street raising their growth outlook for the company into year-end. Of note, McDonald’s opened almost 600 new locations during the great recession of 2008, while most restaurants retreated. The stock is in a confirmed uptrend with further upside potential.
Below is Merck (MRK), which broke out of a 3-month base last week amid news that the FDA has accepted their Keytruda-based therapy for advanced GI cancer for review. This news adds to the company’s exceptionally deep drug pipeline, which has analysts calling for above-average earnings growth over the next five years. The 2.5% yielder is also trading at 15 times trailing 4 quarter earnings, which is below the average P/E for stocks in the S&P 500.
DAILY CHART OF MERCK (MRK)
Healthcare stocks also outperformed during 2008 and, while we’re not calling for a recession that will be anywhere close to what took place back then, precedence tells us that innovative drug companies can fare well despite a difficult economic backdrop. MRK has positive momentum, with its RSI and MACD above 50 and headed higher, and last week’s base breakout puts the stock in a position to trade higher.
While Technology stocks have underperformed over the past two weeks, the sector remains in an uptrend with select areas posting solid gains. My MEM Edge Report has several high quality Technology stocks on the Suggested Holdings List that have been outpacing the broader markets and are poised to continue to do so. We’ll stay with these stocks as long as they remain in an uptrend.
If you’d like immediate access to my Suggested Holdings List, as well as be kept on top of our detailed market and sector rotation analysis during these choppy times, use this link for a 4-week trial of my twice weekly MEM Edge Report at a nominal fee.
Warmly,
Mary Ellen McGonagle, MEM Investment Research


