


After a very strong move in the week before this one, the markets chose to take a breather. They moved in a wide range but ended the week on a mildly negative note after rebounding from their low point of the week. While defending the key levels, the markets largely chose to stay within a defined range. The trading range remained reasonably wide; the Nifty oscillated in a 600.55-point range over the past five sessions. The volatility inched modestly higher; the India Vix rose 4.40% to 17.28 on a weekly basis. While keeping its head above crucial levels, the headline index closed with a net weekly loss of 166.65 points (-0.67).
The coming week will be an expiry week; we will have monthly derivatives expiry playing out as well. Going by the options data, the Nifty has created a trading range between 25100 and 24500 levels. The markets are likely to consolidate in this 600-point trading range. A directional bias would emerge only if the Nifty takes out 25100 on the upside convincingly or ends up violating the 24500 level. While the underlying trend stays intact, the markets are unlikely to develop any sustainable trend so long as they do not move past the 25100 level. While the markets stay in the defined range, it would be prudent to vigilantly guard profits at higher levels and rotate sectors effectively to remain invested in the relatively stronger pockets.
The coming week is likely to see the levels of 25000 and 25175 acting as potential resistance points. The supports come in lower at 24600 and 24450 levels.
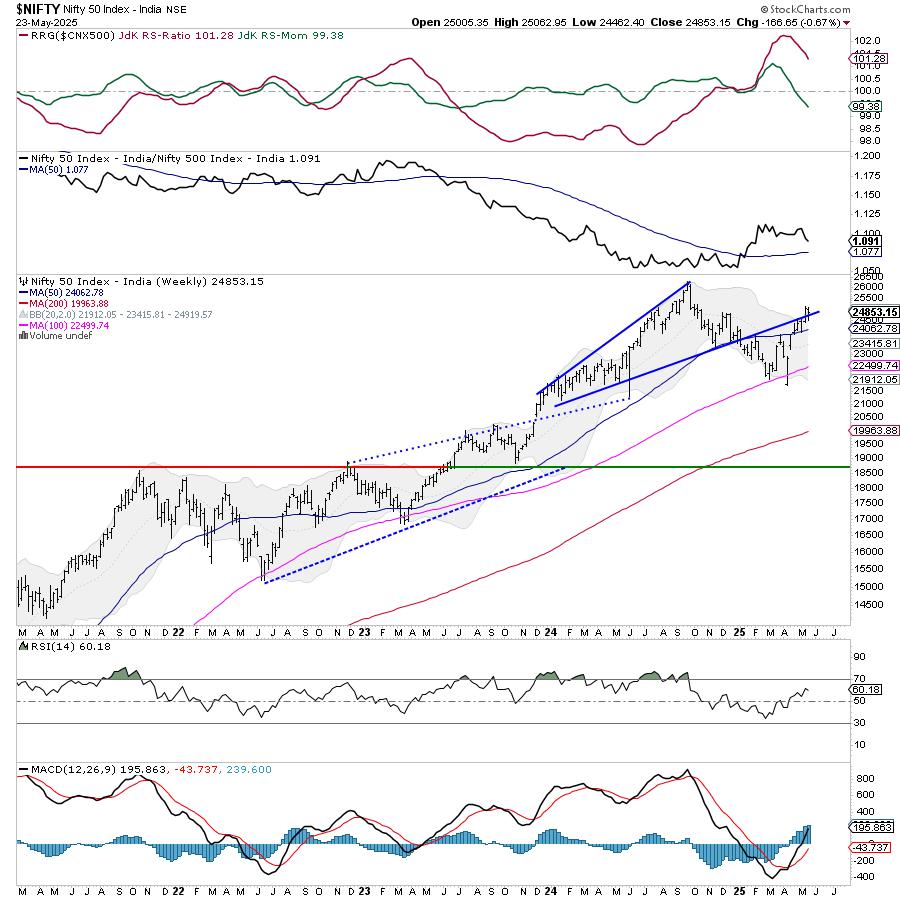
The weekly RSI is at 60.14; it stays neutral and does not show any divergence against the price. The weekly MACD is bullish and stays above its signal line.
The pattern analysis shows that the Nifty has formed a trading range between 25100 on the higher side and 24500 on the lower side. This means that a directional bias would emerge only if Nifty moves past 25100 convincingly or violates the 24500 level. Until either of these two things happens, we will see the Nifty consolidating in this defined range. The Nifty has so far defended the pattern support level that also exists in the 24400-24500 zone.
Overall, the markets continue to remain in a challenging environment and face strong resistance near the 25100 level. So long as the Nifty stays below this level, it stays prone to corrective spikes, which may also keep volatility at slightly elevated levels as well. Given the current technical structure, it would be imperative that not only the sectors be rotated properly to stay invested in relatively stronger pockets, but all existing gains must also be vigilantly guarded at current levels by the investors. While continuing to keep leveraged exposures at modest levels, a cautious outlook is advised for the coming week.
Sector Analysis for the coming week
In our look at Relative Rotation Graphs®, we compared various sectors against the CNX500 (NIFTY 500 Index), representing over 95% of the free-float market cap of all the listed stocks.
Relative Rotation Graphs (RRG) show that while the Nifty Consumption, PSU Bank, Infrastructure, Banknifty, FMCG, and Commodities indices are in the leading quadrant, all are showing a distinct slowdown in their relative momentum against the broader Nifty 500 Index. While these groups are likely to show resilience and may relatively outperform, except for the Consumption Index, they are giving up in favor of other sectors that are showing renewed relative strength.
The Nifty Financial Services Index has rolled inside the weakening quadrant. The Nifty Metal and Services Sector Indices are also inside the weakening quadrant.
While the Nifty Pharma Index continues to languish inside the lagging quadrant, the IT Index, which is also inside the lagging quadrant, is showing sharp improvement in its relative momentum against the broader markets.
The Nifty Realty, Auto, Midcap 100, and Energy Sector Indices are inside the improving quadrant. These groups are expected to continue bettering their relative performance against the broader markets.
Important Note: RRG™ charts show the relative strength and momentum of a group of stocks. In the above Chart, they show relative performance against NIFTY500 Index (Broader Markets) and should not be used directly as buy or sell signals.
Milan Vaishnav, CMT, MSTA
Consulting Technical Analyst


