


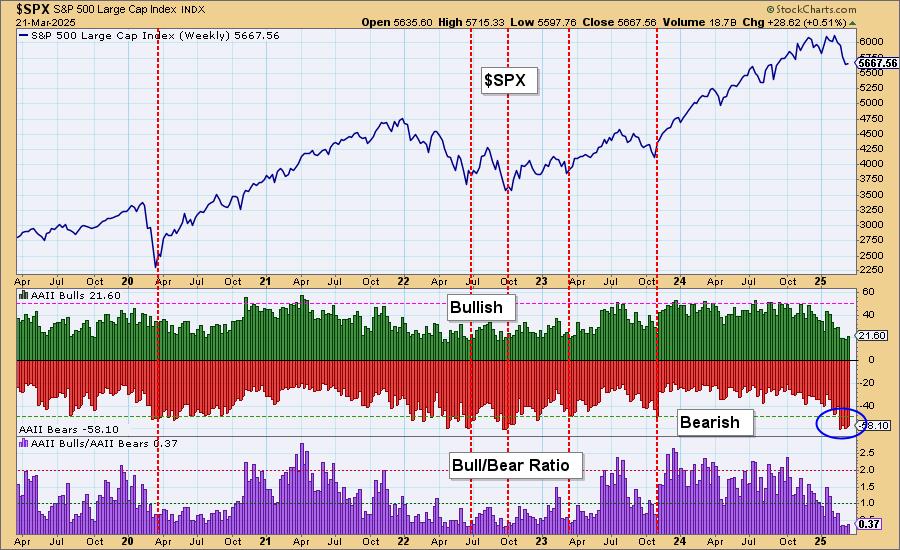
We wrote about the American Association of Individual Investors (AAII) poll results a few weeks ago. Since then the bearish activity on the chart has broken a record for the poll. Since the poll’s inception in 1987 we have never seen four weeks in a row of bearish readings above 55%. We are now at bearish extremes for this indicator.
Remember that sentiment, which this poll measures, is contrarian. This means that when market participants are extraordinarily bearish it is a bullish indication. The opposite also applies, extraordinarily bullish readings are bearish for the market.
Clearly you can see that even after and during the bear market in 2022 we never saw a cluster of readings this high. This has put the bull/bear ratio at a very low reading. This has typically resulted in an upside reversal.
One thing we would say is that sometimes poll takers are RIGHT! So while we do see extremely bearish readings, we wouldn’t bet the house that this isn’t a bear market. At DecisionPoint.com we have been monitoring our indicators and participation and we are considering that we are in the throws of a bear market rally and that it isn’t likely to stick around. However, charts like this do have us wondering if the correction is all we’ll get.
Conclusion: Sentiment is extremely bearish on AII and typically this will lead to a sustained rally. However, we have to understand that sometimes the respondents are correct and we’ll see more downside after all.
The DP Alert: Your First Stop to a Great Trade!
Before you trade any stock or ETF, you need to know the trend and condition of the market. The DP Alert gives you all you need to know with an executive summary of the market’s current trend and condition. It not only covers the market! We look at Bitcoin, Yields, Bonds, Gold, the Dollar, Gold Miners and Crude Oil! Only $50/month! Or, use our free trial to try it out for two weeks using coupon code: DPTRIAL2. Click HERE to subscribe NOW!
Learn more about DecisionPoint.com:
Watch the latest episode of the DecisionPointTrading Room on DP’s YouTube channel here!
Try us out for two weeks with a trial subscription!
Use coupon code: DPTRIAL2 Subscribe HERE!
Technical Analysis is a windsock, not a crystal ball. –Carl Swenlin
(c) Copyright 2025 DecisionPoint.com
Disclaimer: This blog is for educational purposes only and should not be construed as financial advice. The ideas and strategies should never be used without first assessing your own personal and financial situation, or without consulting a financial professional. Any opinions expressed herein are solely those of the author, and do not in any way represent the views or opinions of any other person or entity.
DecisionPoint is not a registered investment advisor. Investment and trading decisions are solely your responsibility. DecisionPoint newsletters, blogs or website materials should NOT be interpreted as a recommendation or solicitation to buy or sell any security or to take any specific action.
Helpful DecisionPoint Links:
Price Momentum Oscillator (PMO)


