


It’s been rocky for the S&P 500 and particularly rocky for some industry groups and sectors. The market does appear ready to give us a good bounce, but past that we aren’t overly bullish.
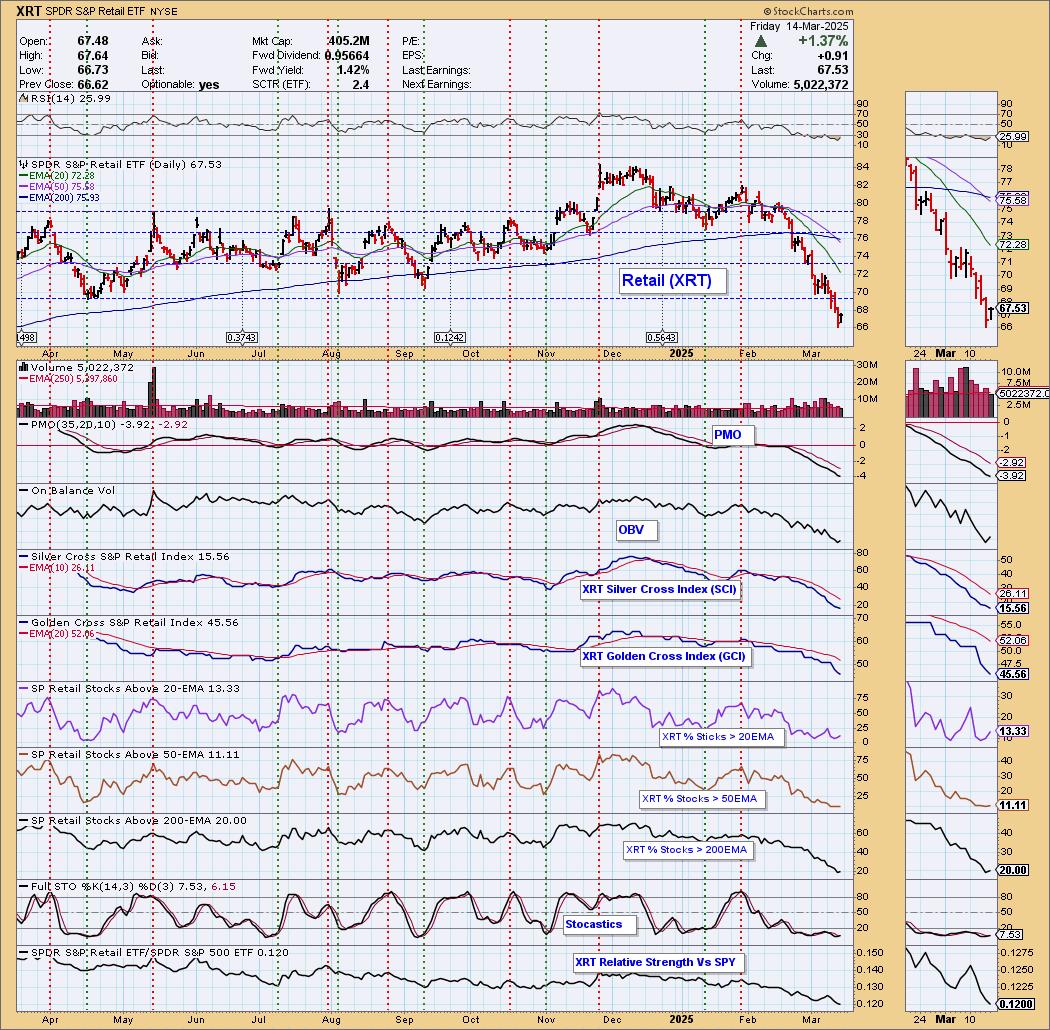
Tariff talk has really pummeled the Retail (XRT) industry group and we don’t see much relief in sight. The daily chart below doesn’t even show the next level of support. There was a recent Death Cross of the 50- and 200-day EMAs. Friday saw a good bounce but it wasn’t enough to really improve the under the hood indicators. Let’s look at our “under the hood” chart for XRT.
Participation is anemic, with all readings below our bullish 50% threshold. It will be very difficult to turn this decline around when so few stocks have price above their key moving averages. The Silver Cross Index is at a very low 16% and the Golden Cross Index is below our bullish 50% threshold. Both the Silver and Golden Cross Indexes are below their signal lines and falling, so the IT and LT Bias is BEARISH. The PMO is at an extremely low reading below the zero line. We don’t see much upside available to XRT; even if we do get a bounce, overhead resistance is very near at 69.
(For more “under the hood” charts of major indexes, sectors and select industry groups, subscribe to DecisionPoint subscription(s) for full access to the ChartList.)
The weekly chart shows a bearish rising wedge that executed as expected with a drop below the rising bottoms trendline. The weekly PMO is accelerating lower. It has landed on a strong support level, but, given that weekly PMO, we have to wonder if this level will hold.
Conclusion: Tariff talk is taking its toll on the Retail industry group and a trade war isn’t out of the question. This will continue to put downside pressure on this group. Key support has been reached on the weekly chart, but, given indicators on both the daily and weekly charts, it doesn’t look that sturdy.
The DP Alert: Your First Stop to a Great Trade!
Before you trade any stock or ETF, you need to know the trend and condition of the market. The DP Alert gives you all you need to know with an executive summary of the market’s current trend and condition. It covers more than the market! We look at Bitcoin, Yields, Bonds, Gold, the Dollar, Gold Miners and Crude Oil! Only $50/month! Or, use our free trial to try it out for two weeks using coupon code: DPTRIAL2. Click HERE to subscribe NOW!
Learn more about DecisionPoint.com:
Watch the latest episode of the DecisionPointTrading Room on DP’s YouTube channel here!
Try us out for two weeks with a trial subscription!
Use coupon code: DPTRIAL2 Subscribe HERE!
Technical Analysis is a windsock, not a crystal ball. –Carl Swenlin
(c) Copyright 2025 DecisionPoint.com
Disclaimer: This blog is for educational purposes only and should not be construed as financial advice. The ideas and strategies should never be used without first assessing your own personal and financial situation, or without consulting a financial professional. Any opinions expressed herein are solely those of the author, and do not in any way represent the views or opinions of any other person or entity.
DecisionPoint is not a registered investment advisor. Investment and trading decisions are solely your responsibility. DecisionPoint newsletters, blogs or website materials should NOT be interpreted as a recommendation or solicitation to buy or sell any security or to take any specific action.
Helpful DecisionPoint Links:
Price Momentum Oscillator (PMO)


