


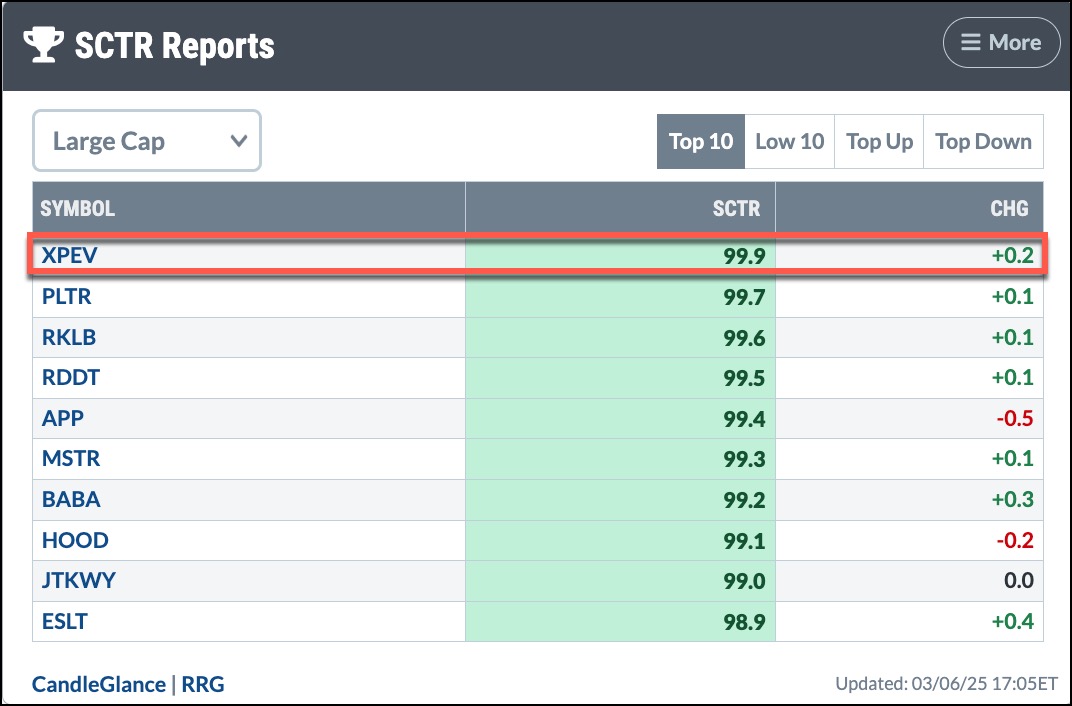
And, the Oscar, er, top StockCharts Technical Rank (SCTR) goes to XPeng, Inc. (XPEV), a Chinese smart electric vehicle (EV) manufacturer. XPEV has silently crept its way to the top of the list.
The Chinese EV industry has seen increased sales in the last month. This has made the space much more competitive for Tesla, Inc. (TSLA), which is seeing its sales in China decline. With XPeng’s new SUV slated to hit the market soon, XPEV has high hopes for 2025. I’m sure we’ll hear more about this when the company announces earnings on March 18, before the US market opens.
XPeng’s stock price has been rising steadily since August 2024, attracting the attention of several Wall Street analysts, many of whom have upped their ratings on the stock. And for good reason. The chart below compares XPEV stock to TSLA stock. Since mid-December, TSLA’s stock price (black solid line) has declined while XPEV’s has risen.
FIGURE 1. XPEV’S STOCK PRICE VS. TSLA’S STOCK PRICE. TSLA was the outperformer until mid-December, after which it started declining. In February 2025, XPEV outperformed TSLA.Chart source: StockCharts.com. For educational purposes.
Technically, XPEV has a lot going for it.
The stock is in a steady uptrend—its one-year performance is +132.81%.XPEV’s SCTR score of 99.9 indicates the stock is technically strong.The relative strength index (RSI) has just crossed 70, indicating there’s room for XPEV’s stock price to move higher.
The daily chart shows the stock price is trading close to its 52-week high of $22.80. A breakout above this level would be positive for the stock and could pave the way for the stock price to move toward its all-time high of $74.49. Let’s switch to the weekly chart of XPEV.
The weekly chart below shows XPEV’s stock price is approaching its weekly July 2023 high, which could be the more likely resistance level XPEV would have to break through.
FIGURE 2. WEEKLY CHART OF XPEV’S STOCK PRICE. The stock price is approaching its 2023 weekly high, which could act as a resistance level. The percentage price oscillator in the lower panel indicates strong momentum in the stock’s price.Chart source: StockCharts.com. For educational purposes.
The percentage price oscillator (PPO) in the lower panel shows the stock has had strong upside momentum and could be overbought. A pullback in the stock’s price is likely to occur. If this pans out and XPEV reverses and pushes through the resistance on the weekly chart with a strong upside follow-through, it would be worth adding XPEV to your portfolio.
Keep an eye on this one. At the rate smart EVs are going, don’t be surprised to find flying cars coming to dealerships.
Disclaimer: This blog is for educational purposes only and should not be construed as financial advice. The ideas and strategies should never be used without first assessing your own personal and financial situation, or without consulting a financial professional.


