I’m a follower and believer of history when it comes to the stock market. After years of research, I understand that some aspects of U.S. equity performance are rather transparent and resulting technical signals generally can be relied upon. There were plenty of warning signals to open 2022 that suggested we were in short- to mid-term trouble and I wrote and talked about them throughout the first six months of 2022. But many of my signals changed in mid-June, leading me to call a bottom in June 2022. The risks of remaining short were too great, while the reward to risk on the long side had improved considerably. Those who transitioned back into the stock market last summer have been handsomely rewarded with the S&P 500 up 13% now off that low.
I was criticized for calling for a bear market before it started and later criticized when I suggested the bear market was over – well before anyone else suggested it. It takes thick skin to go against the masses, but I simply call what I see. It helps that I’m not brainwashed by all the negativity in the media. The lesson here is to keep StockCharts.com turned on and all the outside noise TUNED OUT!
The Fed and Inflation
On Wednesday, the Fed acknowledged it’s winning the war on inflation. We’ll probably see one more 25 basis point hike in the fed funds rate, but beyond that, I see a much more dovish Fed. I believe rates will come down later in 2023 and, if the January jobs report was any indication, a very soft landing is entirely possible. Growth with falling rates is NIRVANA for equity prices. In 2022, we had two quarters of negative GDP with rising rates. That’s what the S&P 500 priced in during its 27% cyclical bear market drop. The NASDAQ fell closer to 40%. It was all baked in.
Bear Market: Cyclical vs. Secular
Many were, and some still are, calling for a secular bear market, which is a long-term bear market. The problem is that you can’t call a long-term bear market until it confirms. We’ve had 3 secular bear markets since 1950. 3!!!! If you’re counting them on your hand, you still have two fingers left. Put another way, they don’t happen very often, yet the Peter Schiffs of the world are granted way too much air time on CNBC to spew their nonsense. Think about it. Why would CNBC continue to cater to someone who has repeatedly missed the biggest bull markets in history and called the market wrong year after year after year? It’s the train-wreck approach to driving viewership, an embarrassment if you ask me.
The Big Picture
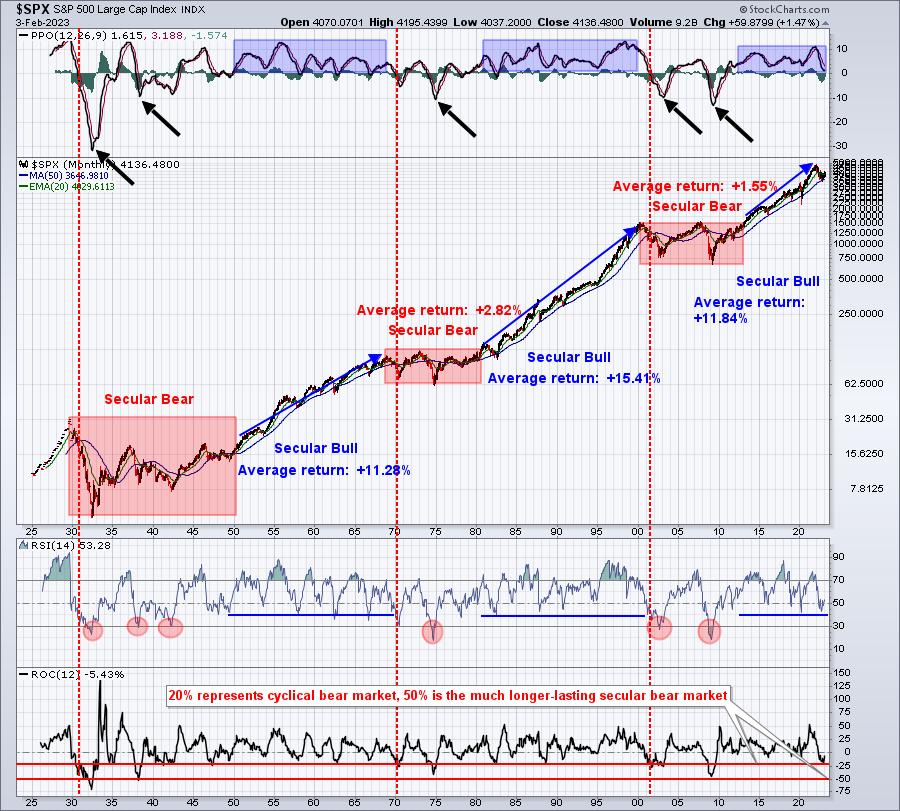
Anyone who has been to any of my market outlook webinars knows that I start off every one of them with a BIG PICTURE 100-year chart of the S&P 500. Here’s what it currently looks like:
Honestly, how can you look at this chart and continually be bearish U.S. equities? We are in another long-term period (secular BULL market) where U.S. equities are in favor. There will occasionally be short-term periods of weakness, especially after huge rallies like we had in 2020 and 2021. Those are cyclical bear markets that require patience. You need to recognize those periods BEFORE they happen, because swing trading strategies will no longer be rewarded and you can lose a lot of money quickly. That’s why I told EarningsBeats.com members at the beginning of 2022 that we needed to realize that conditions would change and swing trading wouldn’t work. You either need to move to cash or become more aggressive on the short side. In early February, I hosted a webinar, Anatomy of a Cyclical Bear Market, to help our members understand what we were going to be facing. If you simply stuck with what had been working, you’d be no better off than Cathie Wood, who managed her ARK funds into the ground over the past couple years. She never adjusted to the cyclical bear market at hand and her investors paid a ridiculously-hefty price. It should have been avoided.
But let’s get back to that chart above. I use it for perspective. And “perspective” is my word for 2023, replacing “patience” in 2022. This big picture view helps me weather markets like 2022, believing that we’ll come out of it stronger than ever, returning to all-time highs. But you have to exercise patience during the turmoil. During secular bear markets, the monthly PPO turns decidedly negative. That has yet to happen as the monthly PPO remains positive and looks as though it’s beginning to turn back up. Also, during secular bear markets, the monthly RSI dips well below 40. The monthly RSI has already bottomed above 40 and has moved back up into the 50s. You need technical confirmation of a secular bear market and we’re seeing none.
The Future Path
We’ve seen a very nice rally. January was one of the strongest on record, the 9th best January on the S&P 500 since 1950. Strong Januarys almost always result in very strong years. It’s not a perfect science and certainly not a guarantee, but there’s a lot of history that suggests the probabilities of a strong year increase substantially. Also, the biggest issue that we faced in 2022 was sentiment. It was way too bullish at the end of 2021 on the heels of the biggest 22-month increase in the S&P 500 since the 1930s. We badly needed sentiment to turn bearish and that only happens one way – a lengthy bear market where everyone’s psyche turns from ecstasy to despair. We needed all the YouTube experts (sarcasm) unanimously believing it was impossible to see a market bottom and that our only path was lower. That’s the type of mentality that marks bottoms.
Fortunately, after months of pain, we got to where we needed to get and the bottom formed. The October 2022 low will mark the 7th time in the last 14 bear markets (6 of 11 if we only look at cyclical bear markets) that the bear market bottom occurred in October. Because many investors do not recognize the end of bear markets, they also miss out on the huge market gains that typically follow. Below is a table of the 11 cyclical bear markets since 1950, showing the gains made in the following 6-month, 1-year, 2-year, and 5-year periods:
Look at those 1-year returns after cyclical bear markets ended. The worst 1-year return was 29.59%. If we apply that WORST return to the October 2022 low, then we should expect the S&P 500 to be at 4525 by October 2023. If we apply the AVERAGE 1-year return of 42.50%, then we’ll see the S&P 500 at 4975. All of a sudden, all-time highs don’t seem to be that far away.
Unfortunately, this is the type of research at EarningsBeats.com that CNBC and other media outlets could produce if they truly were interested in providing valuable educational content for their viewers. But it’s all about the mighty dollar. Education takes a back seat to profits. Their interests lie in advertising dollars and scaring viewers into watching with ridiculously-bearish headlines, and the quicker that everyone recognizes that, then the quicker they can walk away and focus on what’s truly important.
Please join my FREE EB Digest newsletter if you haven’t already. CLICK HERE to enter your name and email address. There’s no credit card required and you can unsubscribe at any time.
Happy trading!
Tom


