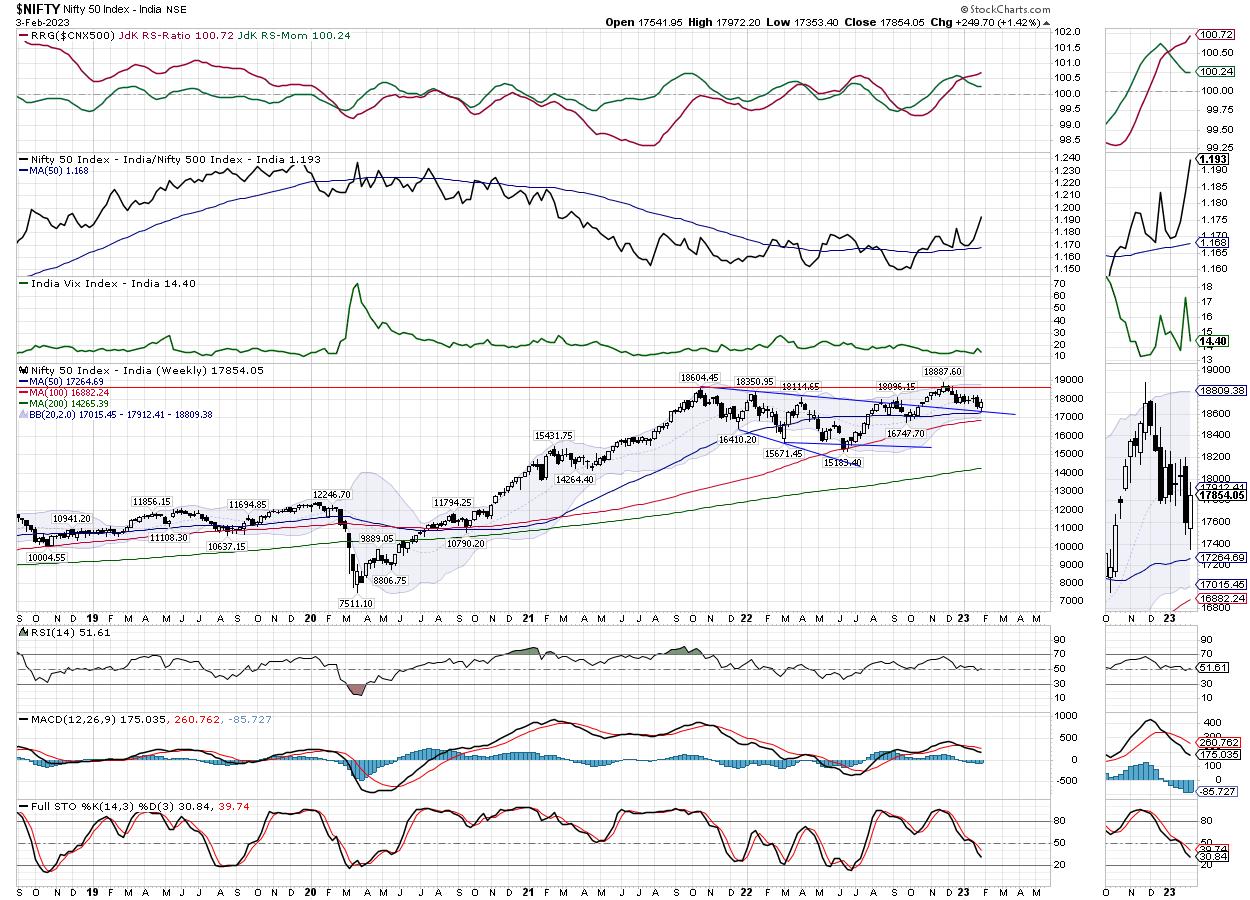
As the week came to an end, the equity markets left behind a very eventful week. Two important events were expected to infuse volatility into the markets. The first one was the Union Budget; this event is one of the most major external domestic events that the markets react to. The other one was the Fed Rate hike that came in the late evening on the same day. The Fed, on the expected lines, raised the rates, but at a slower pace. Over the past five sessions, the NIFTY oscillated in a trading range of 618 points; this entire trading range was created on the day when the Union Budget was tabled in the parliament. On this day, the headline index oscillated violently by 300 points on either side. In the end, while ending on a much stronger-than-expected note, the NIFTY closed with a net gain of 249.70 points (+1.42%) on a weekly basis.
Following the release of the Hindenburg Report, the Adani Group stocks continued with their rout. Coming back to the core technical perspective, the NIFTY had violated the short-term 20-Week MA after taking support on it for five weeks. This 20-WMA is presently at 17912. Unless this point is taken out, it is likely to pose some resistance to the Index on a closing basis. Another important resistance point to watch out for is that of 100-DAY, MA which is presently at 17945. This makes the zone of 17900-17950 an immediate and important resistance area for the Nifty going ahead from here.
Despite such wild swings, volatility declined. INDIAVIX came off by 16.87% to 14.40. Over the coming week, the NIFTY has major resistance at 17950 and 18190 levels. The support would come in much lower at 17520 and 174360 levels. The trading range is expected to stay wider than usual.
The weekly RSI is 51.61; it continues to stay neutral and does not show any divergence against the price. The weekly MACD is bearish and remains below the signal line.
The pattern analysis of the weekly chart shows that inherently, the Index failed to stage a breakout above 18600; it marked its incremental high at 18887 following which it slipped below the breakout point. After that retracement, the NIFTY took support at 20-Week MA for five weeks and that support also got violated in the recent past. Technically speaking, this 20-DMA level at 17912 remains an important resistance point for the NIFTY followed by 100-Day MA on the daily charts at 17945. This has created a resistance zone of 17900-17950 for the Index.
With all major events out of the way, the markets are likely to continue to remain in a wide trading range. Unless the zone of 17900-19750 is taken out convincingly, we are unlikely to see any meaningful and sustainable uptrend here. It is strongly suggested despite the pullback that we witnessed from the lows of the week, one must not get carried away and continue to vigilantly protect the profits at higher levels unless NIFTY goes comfortably above 18000 levels. It is expected that pockets like IT, PSE, and select Auto stocks may do well besides some stock-specific performance coming in from the rest of the sectors. It is recommended to keep leveraged positions under control and overall exposures at modest levels. A cautious outlook is advised for the coming week.
Sector Analysis for the coming week
In our look at Relative Rotation Graphs®, we compared various sectors against CNX500 (NIFTY 500 Index), which represents over 95% of the free float market cap of all the stocks listed
The analysis of Relative Rotation Graphs (RRG) leaves us with some interesting insights. After weeks of strong relative performance, the Nifty Metal and PSU bank indexes have rolled inside the weakening quadrant. The individual performance may still persist; however, these groups may start to relatively underperform the broader NIFTY 500 Index. The Oher sectors like Infrastructure, PSE, and Commodities are inside the leading quadrant but they are rapidly seen giving up on their relative momentum against the broader markets.
Importantly, the NIFTY IT and FMCG have rolled inside the leading quadrant. They are set to relatively outperform the markets.
The NIFTY Financial Services, Banknifty, and Services Sector Indexes are inside the weakening quadrant.
The Realty, Media, and Energy indexes continue to languish inside the lagging quadrant. Nifty Consumption Index is inside the lagging quadrant; however, it is seen sharply improving in its relative momentum.
The Pharma and Auto Index has rolled inside the improving quadrant. This marks a potential beginning of a phase of their relative outperformance against the broader markets.
Important Note: RRG™ charts show the relative strength and momentum of a group of stocks. In the above Chart, they show relative performance against NIFTY500 Index (Broader Markets) and should not be used directly as buy or sell signals.
Milan Vaishnav, CMT, MSTA
Consulting Technical Analyst
www.EquityResearch.asia | www.ChartWizard.ae


