From a bullish perspective, I was hoping to see the “goldilocks” jobs report, one which still showed job growth, but came in below consensus estimates. The thought there is that the Fed would see that its rate-hiking campaign was working and the economy was slowing. Instead, we saw a much-larger-than-expected jobs number, 336,000 vs. 160,000. Immediately, futures fell from positive to negative, and we’ll likely be experiencing price action today that tests, if not pierces, recent price lows across our major indices.
But were there any silver linings? Well, actually yes. The obvious is that our economy remains resilient, keeping alive the possibility of a soft landing. A big decrease in jobs and a negative number might have altered that potential outcome. Second, the unemployment rate was expected to drop from 3.8% to 3.7%, but instead remained at 3.8%. Also, average hourly earnings, which is watched by the Fed for further pressure from wage inflation, remained unchanged from the prior month at +0.2%, lower than the +0.3% rise that was forecast.
So while the headline jobs number may have spooked bond investors initially, it’ll be interesting to see the reaction as the rest of the day unfolds and, of course, next week. The September PPI and CPI will be released next Wednesday and Thursday, October 11th and 12th, respectively.
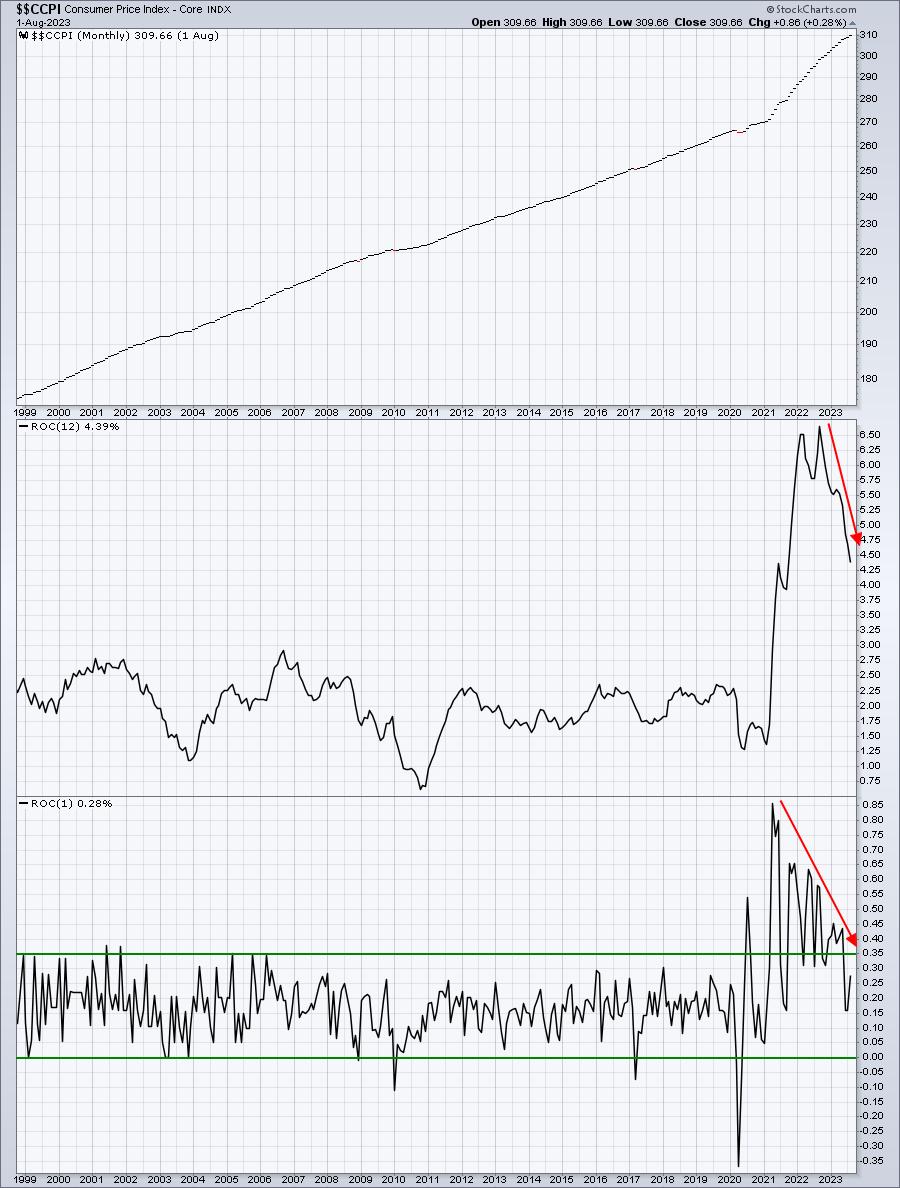
The monthly core CPI is what we should watch most closely and here’s a chart that shows the direction it’s been heading:
Remember, not too long ago, Fed Chief Powell said that the Fed wanted to see a consistent move lower towards its 2% target. Are you reading the above chart differently than me? Not only have we seen the annual core rate of inflation fall from 6.7% to 4.4% in one year, but we’ve also seen the monthly change fall all the way back into its 21st century “normal” range. I can’t help but believe that if next week’s September Core CPI reading comes in at or below 0.4%, we’ll see the start of a Q4 stock market rally, if it hasn’t already begun by then.
On Monday, in our FREE EB Digest newsletter, I’ll be highlighting a chart that says inflation is NOT a problem, despite what the Fed might suggest. If you’d like to see this chart and you’re not already an EB Digest free subscriber, simply CLICK HERE to enter your name and email address. There’s no credit card required and you may unsubscribe at any time.
Happy trading!
Tom


