


Where can investors find a safe haven during a period of market uncertainty? Personally, I think it’s as simple as focusing on the stocks managing to display bullish technical structures at a time when they are becoming remarkably rare! Today we’ll use the StockCharts scan engine to identify charts showing strength despite broader market weakness.
There’s Strength in Financials But Not the Banks
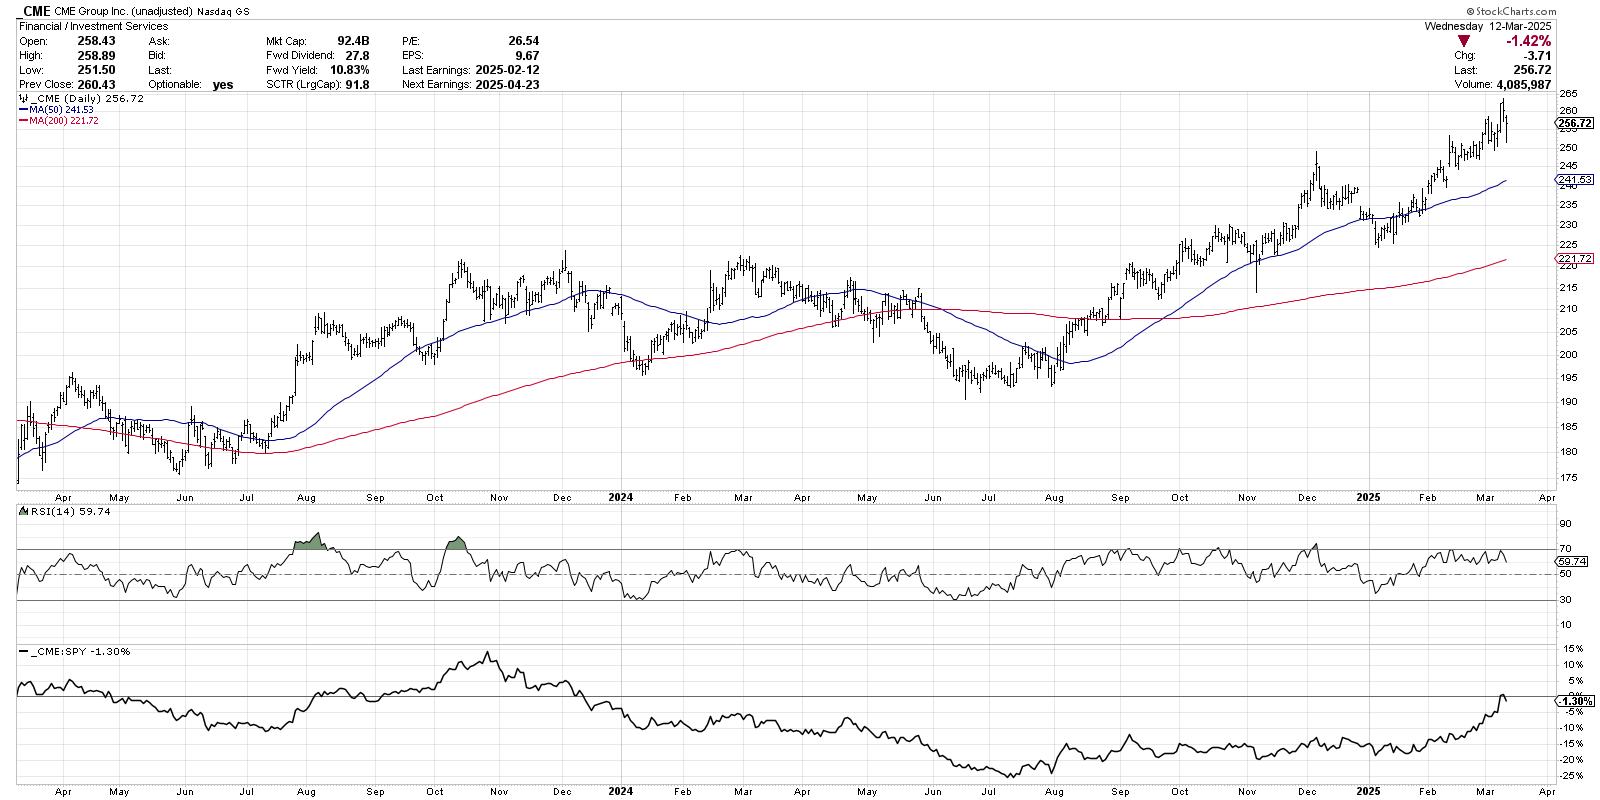
The first chart on my list from this week’s scan, CME Group (CME), was featured in my recent podcast interview with Jay Woods, CMT. We talked about how the financial sector had been quite strong so far in 2025, but that the really impressive charts were the exchanges.
The simple fact that CME currently sits above two upward-sloping moving averages means this name is in a small subset of the S&P 500 that can still make that claim. The momentum picture has remained quite strong, with recent pullbacks bringing the RSI no lower than the 40 level. The improving relative strength at the bottom tells perhaps the most important story, showing how this stock has consistently outperformed the S&P 500 in 2025.
As long as the trend continues to form a pattern of higher highs and higher lows, and the moving averages continue to slope higher, I would consider this chart “innocent until proven guilty.”
Auto Parts Remains a Strong Group in a Struggling Sector
While I’ve found numerous ideas in the Consumer Staples sector in 2025, given the renewed strength in this previously beaten down sector, this next chart is actually in the Consumer Discretionary sector. Auto parts names like Autozone Inc. Nevada (AZO) have pulled back this week from an overbought condition, but the chart remains in a primary uptrend of higher highs and higher lows.
Similar to CME, we can observe a classic uptrend pattern over the last 18 months. We can also see an ascending triangle pattern through much of 2024, with a fairly consistent resistance level and an upward-sloping trendline connecting the swing lows. The upside breakout in December 2024, followed by a retest of that previous resistance level into mid-January, seems to confirm the long-term bullish technical structure.
What strikes me about both of these charts is that they show no real signs of market instability. At a time when it feels like pretty much everything is rotating lower amidst growing market turmoil, stocks that indicate they are somehow immune to bearish market forces deserve our respect and attention.
Three-Month Highs Often Signal Renewed Strength
How did I identify these winning names at a time when they seem very difficult to find? I simply used the StockCharts scan engine to identify stocks making a new 13-week high. You can copy and paste the text below into the Scan Workbench to run this scan using your own login.
[type = stock]
and [group is not ETF]
and [[exchange = NYSE] or [exchange = NASD]]
and [market cap > 5,000]
//and [group is SP500]
and [Weekly Close > Last Week’s MAX(13,Close)]
Those last two lines are the most important, as the rest is basically filtering the universe down to stocks traded on the major US exchanges with a market cap over $5 billion. The fifth line has two slashes before the parameter “group is SP500”, which tells the scan engine to ignore that line. I like to include that line in every scan I run, as I often toggle between a larger equity universe and then just to the S&P 500 members.
The final line looks for stocks where the current weekly closing price is higher than the previous 13 weekly closing prices. And while this particular scan would certainly include stocks that have been in long-term uptrends for well over three months, I’ve found new three-month highs can be a great place to start to look for charts just beginning to emerge from a basing pattern.
For the other three stocks I found earlier this week using this scan, and much further detail on the technical implications of these charts, check out my latest video on the StockCharts TV YouTube channel!
RR#6,
Dave
PS- Ready to upgrade your investment process? Check out my free behavioral investing course!
David Keller, CMT
President and Chief Strategist
Sierra Alpha Research LLC
Disclaimer: This blog is for educational purposes only and should not be construed as financial advice. The ideas and strategies should never be used without first assessing your own personal and financial situation, or without consulting a financial professional.
The author does not have a position in mentioned securities at the time of publication. Any opinions expressed herein are solely those of the author and do not in any way represent the views or opinions of any other person or entity.


