


Utilities enter top 5
Last week’s trading, especially the sell-off on Friday, has caused the Utilities sector to enter the top 5 at the cost of Industrials.
Based on last Friday’s close, the sector ranking based on the combination of weekly and daily RRG metrics came out as follows:
Communication Services – (XLC)Consumer Discretionary – (XLY)Financials – (XLF)Technology – (XLK)Utilities – (XLU)*Industrials – (XLI)*Consumer Staples – (XLP)Energy – (XLE)*Real-Estate – (XLRE)*Healthcare – (XLV)Materials – (XLB)
The best four sectors remain unchanged. At the bottom of the best five sectors, Utilities and Industrials are swapping positions.
In the second half of the ranking, Energy and Real Estate swapped positions, but this has not affected the portfolio yet.
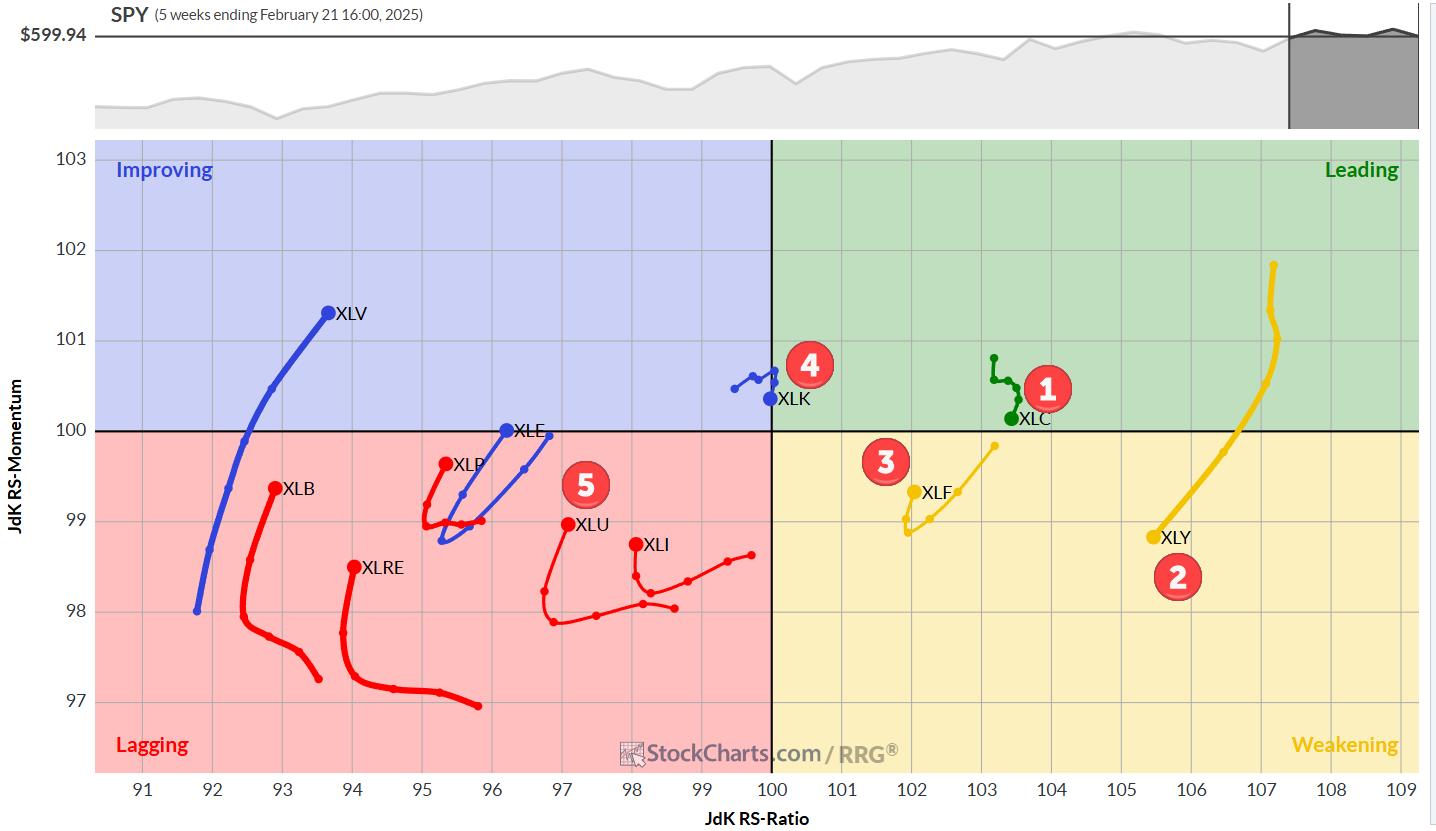
Weekly RRG: Rotations starting to shift direction
On the weekly RRG above, we see Financials turning back up while inside the weakening quadrant; this is a positive sign, suggesting that XLF is entering a new up-leg within an already existing up-trend.
Communication services remain inside the leading quadrant, albeit on a slightly negative heading. The short tail suggests a steady outperformance.
Consumer Discretionary is on a long tail with a negative heading, moving into the weakening quadrant. Based on the high reading on the weekly RRG, this sector remains in the top-5.
Technology shows a dangerous rotation. Immediately after entering the leading quadrant, the tail has rotated back into a negative heading. For now, the short tail saves the day, but caution needs to be exercised when this tail starts to accelerate at this negative heading.
Daily RRG
The daily RRG shows the XLY tail deep inside the lagging quadrant, which is pulling the weekly tail lower. These two time-frames are fighting for dominance in this sector. For now, the longer term, weekly time frame remains on top.
A Look At The Charts
Communication Services (XLC)
XLC is holding up above the former breakout level, which is now providing support. The raw relative strength line maintains the rhythm of higher highs and higher lows but at a lesser pace.
This is reflected in the RS-Momentum line moving lower. Given the high reading of the RS-Ratio line, this is very likely a temporary setback in relative strength.
Consumer Discretionary
The Consumer Discretionary sector is now getting close to completing a double top formation, which would send a negative chart technical signal.
In case of such a break, the target area will very likely be in the 200-210 area.
The deterioration in relative strength has already started, but it needs more time to become convincing enough to materialize a drop out of the top five.
Financials (XLF)
XLF has been consolidating between 50-52 in the past 4-5 weeks relative to the market. This means a slight improvement, which is reflected in both RRH-Lines turning back up. With the tail located inside the weakening quadrant, XLF will be well-positioned for outperformance in the coming weeks.
Technology (XLK)
Another week, another failure to take out overhead resistance.
Once again, the 242 area has proven to be too much of a hurdle for XLK. The close at the week’s low suggests some follow-through in the coming week.
The sector is still within the boundaries of the rising channel, and the RRG-Lines are mildly positive, justifying the #4 spot in the portfolio, but risks are increasing.
Utilities (XLU)
The strong performance since the low mid-January is starting to spill over into the relative strength of the Utilities sector.
The price chart is back in a series of higher highs and higher lows while the RRG-Lines are slowly starting to curl upwards.
The weak rotation for XLY on the daily chart is offset by the strength on the weekly RRG. The situation for XLU is the other way around. Here, XLU’s strong performance on the daily RRG offsets the sector’s weakness on the weekly RRG.
Portfolio Performance Update
The equal weight portfolio (20%/sector) gave back the outperformance that was built since inception. The RRG portfolio was at +2.36% since inception while SPY gained +2.62%.
Not great but no drama either, we will continue to monitor.
#StayAlert, –Julius


