Growth vs Value Rotation, the pendulum swings again
Relative Rotation Graphs (RRG) are not only good for visualizing sector rotation, but they are also valuable tools for visualizing other market dynamics. For example, the relationships between Growth and Value stocks or Large-cap vs. mid- and Small-cap stocks and the combination of these two breakdowns of the market.
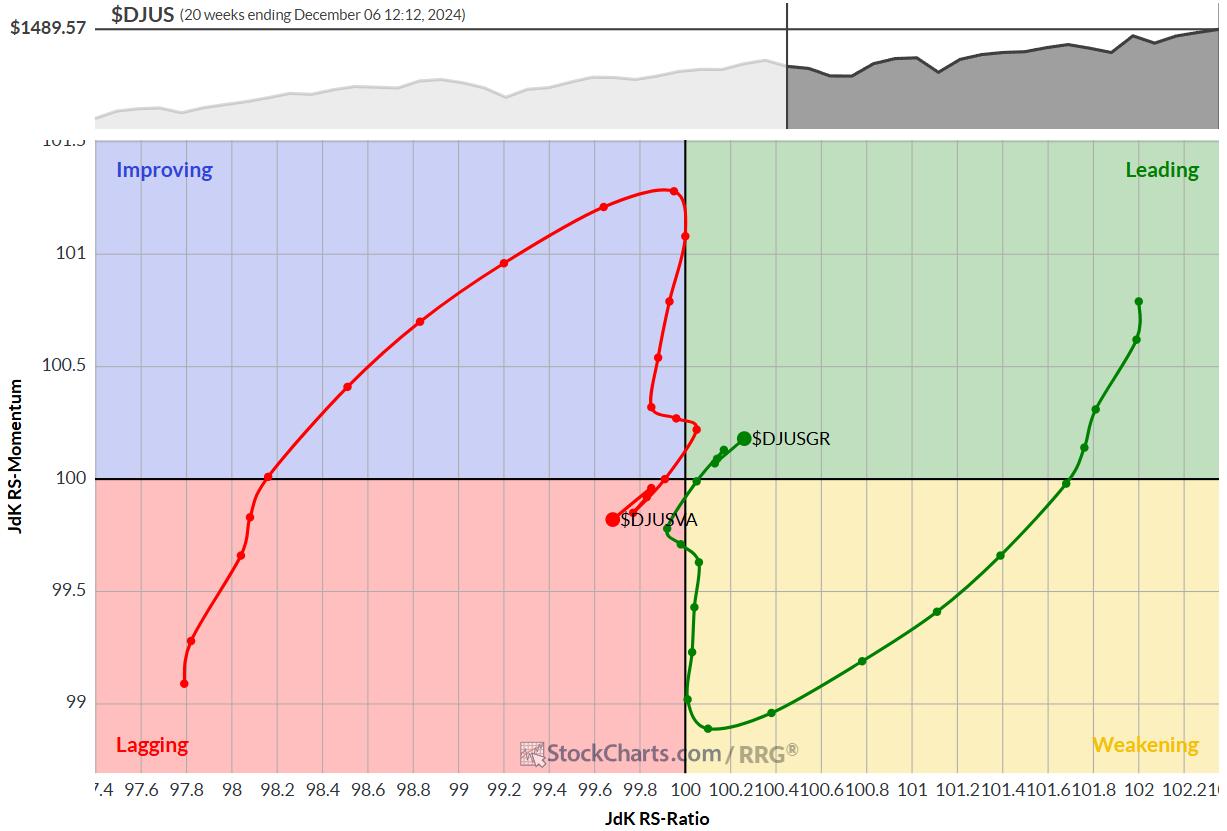
The pure growth-value rotation, as shown in the RRG above, RRG tells an interesting story.
Value had its moment in the sun from August to early October, but the tides have turned since then.
Around the week ending Sept 27, the value tail started to roll over while still inside the improving quadrant and the growth tail did the opposite inside the weakening quadrant. Basically signaling the end of a temporary countertrend move.
Now, it’s clear that growth is once again beating value.
Size Matters: Small and Mid-Caps Take Center Stage
When we add the RRG showing rotations of large, mid, and small-cap stocks, the picture becomes even clearer.
Small and mid-cap stocks are still gaining relative strength in the leading quadrant.
Meanwhile, large caps are languishing in the lagging quadrant, continuing to lose ground.
A More Granular Look: Where the Action Is
Now, let’s get into the nitty-gritty. We get a more nuanced view by combining the breakdown of the US stock universe into growth and value with large, mid, and small caps.
The resulting RRG with six tails, three for growth and three for value broken down into three size segments, paints a vivid picture:
Mid and small-cap growth stocks are the clear leaders, deep in the leading quadrant and heading further into it.
Value small-cap and mid-cap stocks on the right side of the graph are holding their own, although they are losing some relative momentum.
Both the large-cap tails inside the lagging quadrant show this segment’s current weakness. Still large cap growth has just started to curl back up a bit while large cap value continues to head South-West.
This means that large-cap value is now the weakest segment in the market. Inside the lagging quadrant and traveling on a negative RRG-Heading.
What This Means for Investors
Large-caps in general, particularly large-cap value, are best avoided for now.Small-cap and mid-cap growth stocks deserve your attention — they’re where the action is.
Market Outlook: Steady as She Goes
Despite these rotations, the overall outlook for the stock market in the coming weeks remains healthy.
The S&P 500 chart shows the rhythm of higher and lower lows is intact. Divergences causing concern have been negated, and breadth metrics have normalized—they’re no longer sending too many negative signals.
#StayAlert and have a great weekend. –Julius


