


Despite a backdrop of conflicting market signals, there are still sectors within the S&P 500 that are showing promising movements and potential opportunities for investors. Today, I’d like to highlight two sectors in the S&P 500 that are worth a closer look: Industrials and Materials.
The market’s mixed signals
The S&P 500 has recently broken above its resistance, a move that has been met with some skepticism due to the negative divergence observed between the RSI (Relative Strength Index) and price, as well as the MACD (Moving Average Convergence Divergence) and price. Additionally, sector rotation, as indicated by the RRGs (Relative Rotation Graphs), suggests a defensive posture still prevalent in the market.
This creates a somewhat confusing landscape for investors (well at least it does for me), with these conflicting signals flying around.
However, this doesn’t mean that there are no opportunities to be found.
Spotlight on Industrials and Materials
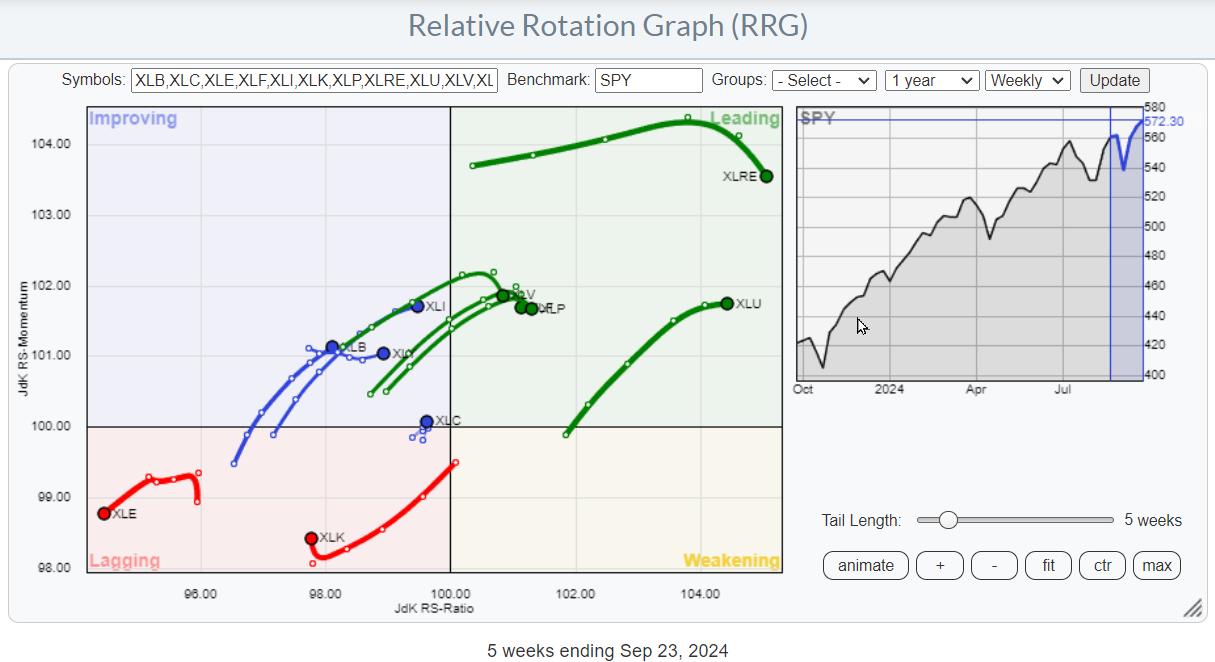
When we focus on the Relative Rotation Graph for US sectors, two sectors stand out: Industrials (XLI) and Materials (XLB). Both sectors are currently positioned in the improving quadrant and are rotating towards the leading quadrant with a strong RRG heading. This means that they are gaining on both axes.
Industrials Sector (XLI)
Looking at the price chart for the industrial sector, we can see that XLI broke to new highs a few weeks ago, well before the S&P 500 did. However, the raw RS (relative strength) line is still in a downtrend, with major highs being lower. We’re approaching a crucial resistance in the RS line, and for the sector to continue its improvement, it needs to break above this falling resistance.
In the coming weeks, it will be more important to monitor the move in relative strength for the industrial sector rather than the price itself. The price is performing well, but a breakthrough in relative strength is needed to push the sector further into the leading quadrant.
Materials Sector (XLB)
The Materials sector has a similar setup to Industrials. The price has also broken to new highs, albeit slightly later. The relative strength series of lower highs and lower lows is still in place, but the RRG lines are both moving higher, pushing the tail further into the improving quadrant toward leading.
Both Industrials and Materials sectors are showing signs that they are worth a closer look for investors seeking to trade individual stocks rather than the market as a whole.
Identifying Strong Performers in Industrials
To find individual stocks within the industrials sector, we bring up the RRG that shows its members. The routine is to look over the individual tails and find those with a strong RRG heading, particularly those that are rotating from leading into weakening and then turning back up towards leading.
Highlighted Stocks: Caterpillar (CAT) and W.W. Grainger (GWW)
Caterpillar (CAT) is positioned in the improving quadrant, having just crossed over from lagging. The price chart shows Caterpillar breaking to new all-time highs after a corrective move, which is causing the relative strength to jump and pushing the RRG lines higher.
This combination of improving relative strength and an upward break in price is a strong indicator.
W.W. Grainger (GWW) is in a similar situation, with the price chart showing a break to new highs and the relative strength line having less of a decline. The RRG lines are indicating a new relative uptrend for GWW against XLI.
Since the sector itself is already in a relative uptrend or starting to move into one versus the S&P 500, stocks like GWW and Caterpillar are strong stocks in a strong sector.
Exploring the Material Sector’s Potential
Using a similar approach for the material sector, we look at the RRG showing the rotations for the individual members and focus on the tails with a strong RRG heading.
Highlighted Stocks: CF Industries (CF) and Eastman Chemical Company (EMN)
CF Industries (CF) is approaching heavy overhead resistance and needs to break above $86. The relative strength line is improving, and the RRG lines are pushing the tail of CF into the leading quadrant. This could be a very good addition to any portfolio, especially if CF breaks and holds above the $86 resistance.
Eastman Chemical Company (EMN) has already broken out of a consolidation period and is moving towards all-time high levels. The raw RS line has broken its previous peak, starting a series of higher highs and higher lows. The RS ratio line is above 100, indicating that EMN is starting a new relative uptrend, which is usually a good sign.
Conclusion
Despite the conflicting signals in the market, there are still pockets of strength to be found.
The industrial and material sectors are two such areas that offer interesting opportunities for investors.
By focusing on individual stocks within these sectors, particularly those with strong RRG headings, we can find potentially strong performers that may outperform both their sector and the broader S&P 500 index.
#StayAlert and have a great weekend. –Julius


