


This is a complimentary excerpt from the subscriber-only DecisionPoint Alert.
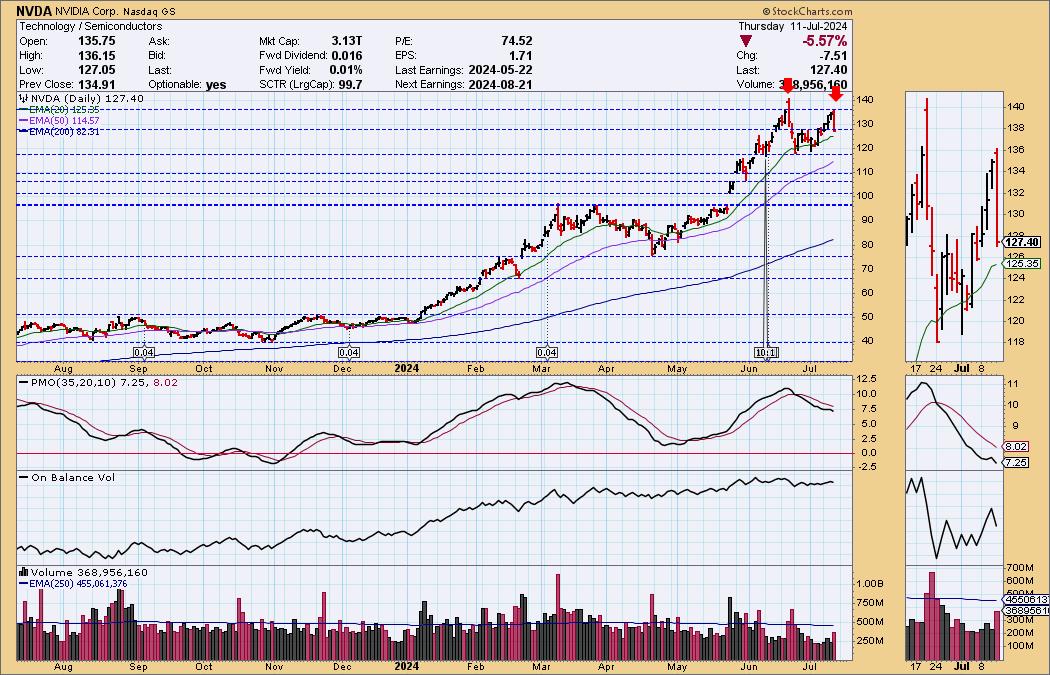
NVIDIA (NVDA) broke down today in what looks like an echo of last month’s pullback. There is a short-term double top with price resting on the confirmation line. This could just be a one day event, but assuming that a correction has begun, we see first support at about 118.00 — a -17% decline. The next most obvious support is at about 97.00 — a decline of about -32%.
The primary problem with NVDA is the steep parabolic advance from the 2022 low. Such advances beg for correction, and we can see three previous corrections on this chart.
As the title said, all the Magnificent 7 appear to entering corrections.
_____________
Today the Russell 2000 ETF (IWM) 20-day EMA crossed up through the 50-day EMA (Silver Cross), generating an IT Trend Model BUY Signal. Like so many other indexes, IWM is in a narrow trading range that generates whipsaw signal changes, but the strength of today’s move implies a probable upside breakout from that range.
The weekly chart shows a PMO rising above the zero line, but we now see a lot of congestion in 2021 that will provide resistance to further advance. That is not to say further advance is not possible, but that it will possibly be more difficult.
Also today, the Retail ETF (XRT) 20-day EMA crossed up through the 50-day EMA (Silver Cross), generating an IT Trend Model BUY Signal. Again we have the narrow trading range and potential for whipsaw. In fact XRT switched to NEUTRAL two days ago. Nevertheless, this seems to be an authentic change of direction, considering that it is a high-volume reversal on a day when part of the market was falling apart.
The weekly chart doesn’t reflect much confirmation regarding this one-day change of direction, but the weekly PMO is flat above the zero line, which is encouraging.
Conclusion: Mega-cap stocks began to break down today, but other areas of the market have new found strength. It is only one day of this ‘bifurcation’ between smaller-caps and mega-caps, but a broadening of the rally could preserve the integrity of this bull market.
Learn more about DecisionPoint.com:
Watch the latest episode of the DecisionPointTrading Room on DP’s YouTube channel here!
Try us out for two weeks with a trial subscription!
Use coupon code: DPTRIAL2 at checkout!
Technical Analysis is a windsock, not a crystal ball. –Carl Swenlin
(c) Copyright 2024 DecisionPoint.com
Disclaimer: This blog is for educational purposes only and should not be construed as financial advice. The ideas and strategies should never be used without first assessing your own personal and financial situation, or without consulting a financial professional. Any opinions expressed herein are solely those of the author, and do not in any way represent the views or opinions of any other person or entity.
DecisionPoint is not a registered investment advisor. Investment and trading decisions are solely your responsibility. DecisionPoint newsletters, blogs or website materials should NOT be interpreted as a recommendation or solicitation to buy or sell any security or to take any specific action.
Helpful DecisionPoint Links:
Price Momentum Oscillator (PMO)


