Connect with us

Hi, what are you looking for?

Stocks

Mastering GoNoGo Charting: Scanning Securities on StockCharts.com

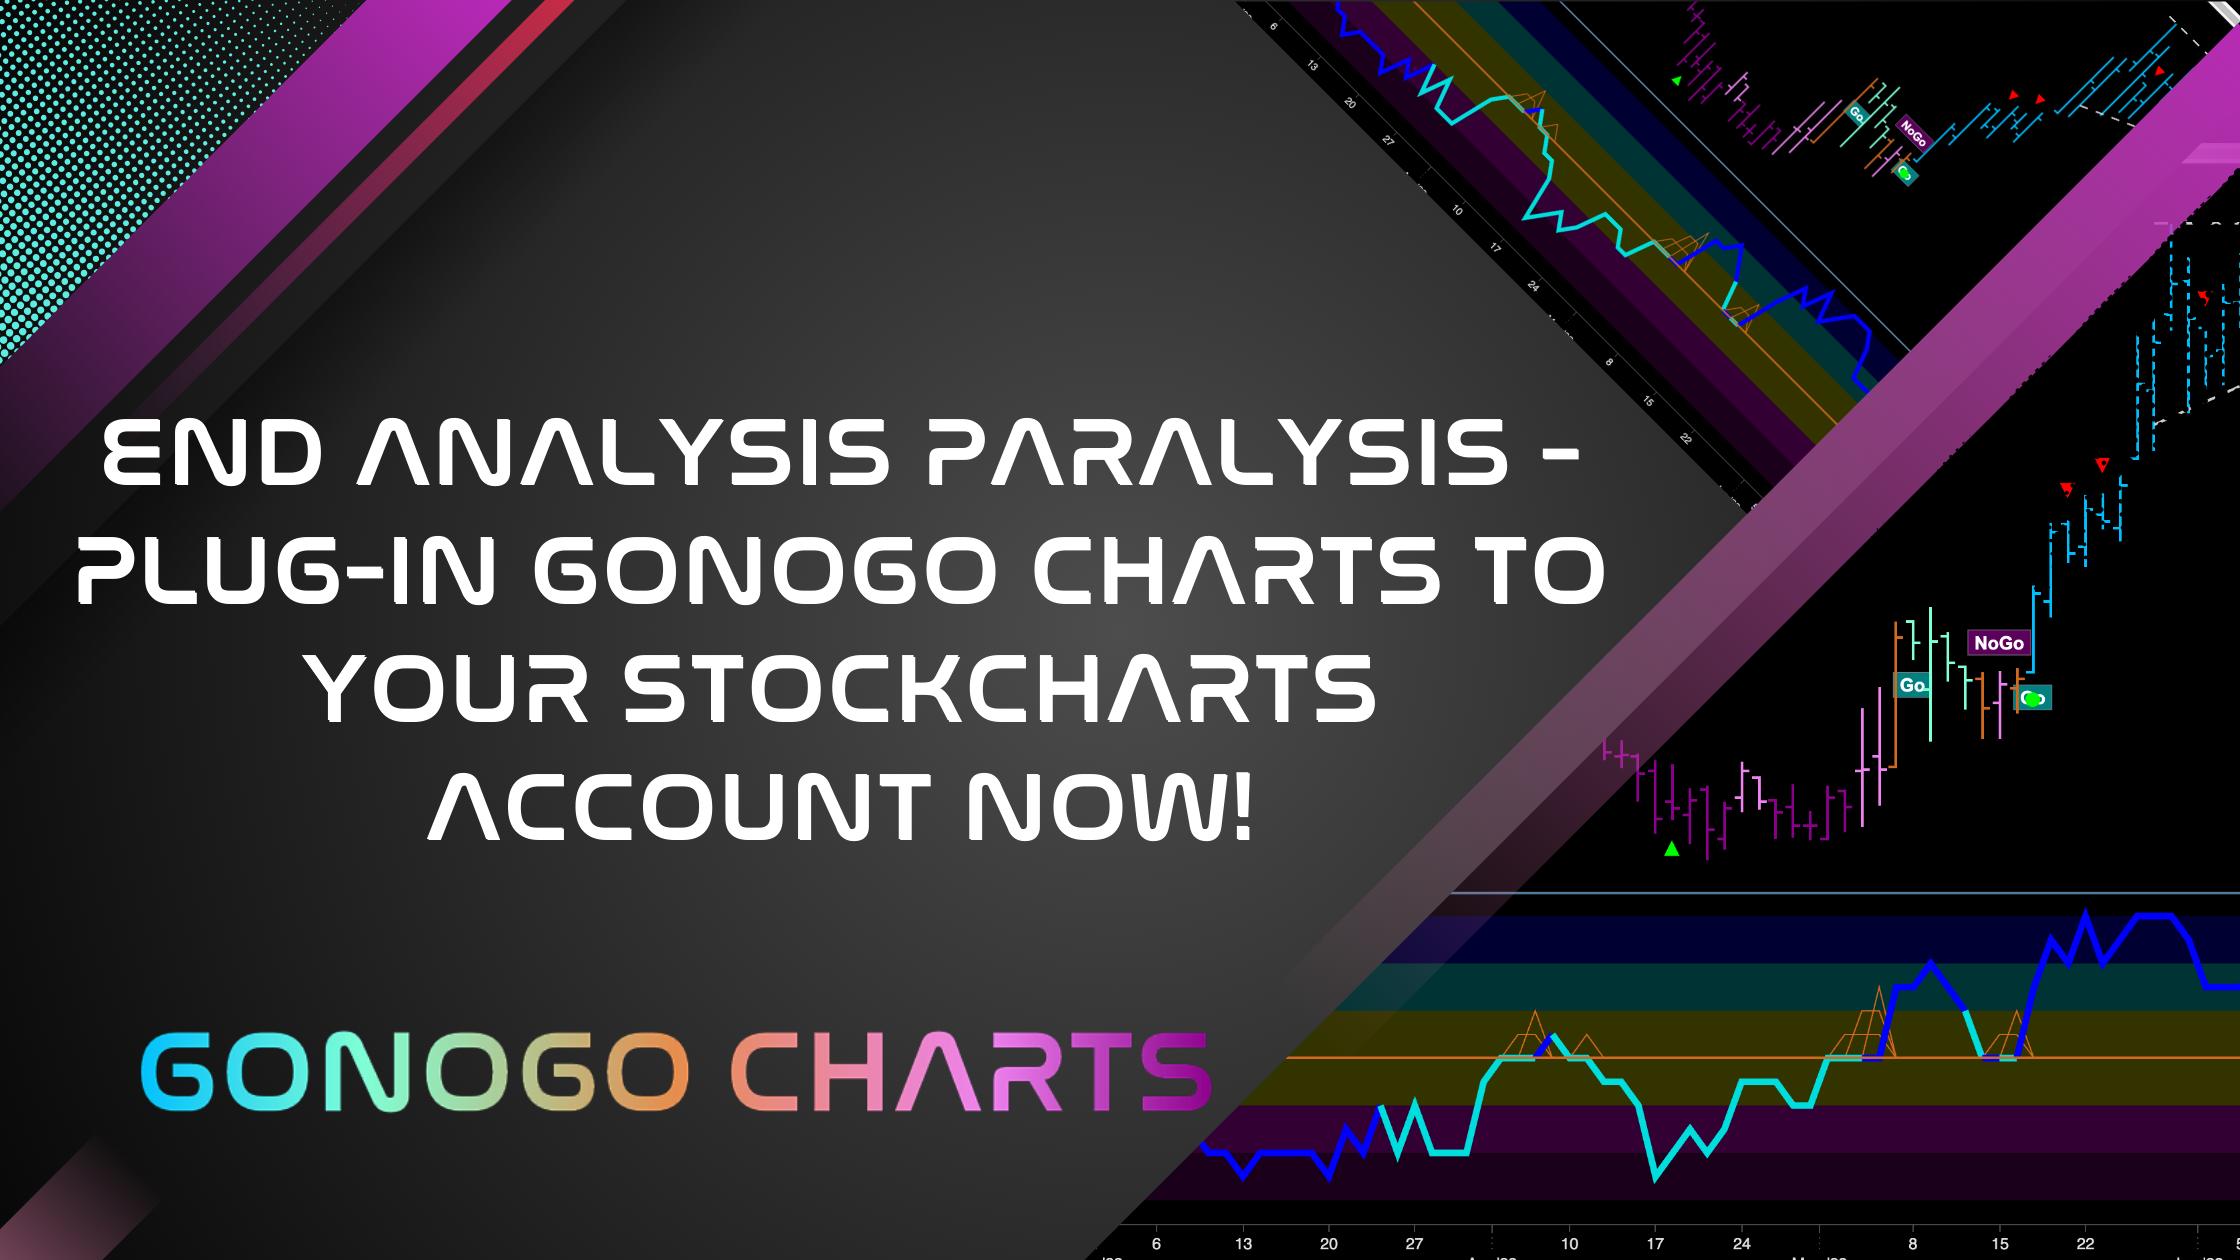
Join Tyler Wood, CMT, in this insightful tutorial where he demonstrates how to effectively scan for GoNoGo conditions using StockCharts.com. GoNoGo Charts, a powerful method developed by Alex Cole and Tyler Wood, blend foundational tools in technical analysis into a powerful and clean data visualization tool, providing traders and investors with a unique perspective on market trends.

Scanning for GoNoGo Criteria in Stockcharts

In this video, Tyler Wood, a seasoned CMT and co-founder of GoNoGo Charts, guides you through the process of setting up scans on StockCharts.com to identify stocks and ETFs that meet specific GoNoGo criteria. Whether you’re looking for trending opportunities, reversals, or confirmation signals, Tyler breaks down the steps clearly and concisely.

Discover how to leverage StockCharts.com’s robust scanning tools to streamline your trading strategies and uncover potential trades aligned with GoNoGo principles. Whether you’re a novice exploring technical analysis or an experienced trader seeking to refine your approach, Tyler’s insights and practical tips will help you navigate the markets with confidence.

Don’t miss out on this opportunity to enhance your trading skills and learn from one of the leading authorities on GoNoGo Charts. Watch now and take your trading to the next level with Tyler Wood, CMT, on StockCharts.com!

    You May Also Like

    Politics

    When George Santos mentioned his family during his congressional campaign, the New York Republican often reflected on the work ethic and strength of his...

    Business

    Two of Sam Bankman-Fried’s top business partners — a co-founder of the cryptocurrency exchange FTX and the former CEO of the hedge fund Alameda...

    Sports

    Kicker Alejandro Mata is following former Tigers coach Deion Sanders to Colorado. ‘Thankful to be committed and signed to the University of Colorado,’ Marta wrote on...

    Stocks

    SPX Monitoring Purposes: Sold long SPX 1/27/23 at 4070.56 = Gain 6.51%; Long on 12/20/22 at 3821.62. The top window is the cumulative GDX...

    Disclaimer: SecretCharts.com, its managers, its employees, and assigns (collectively “The Company”) do not make any guarantee or warranty about what is advertised above. Information provided by this website is for research purposes only and should not be considered as personalized financial advice. The Company is not affiliated with, nor does it receive compensation from, any specific security. The Company is not registered or licensed by any governing body in any jurisdiction to give investing advice or provide investment recommendation. Any investments recommended here should be taken into consideration only after consulting with your investment advisor and after reviewing the prospectus or financial statements of the company.

    Copyright © 2024 SecretCharts.com | All Rights Reserved