


Good morning and welcome to this week’s Flight Path. We saw another strong week of blue “Go” bars for the equity index. Treasury bond prices also maintained strong blue “Go” colors for the entire week. U.S. commodities almost did the same, but the week ended with a weaker aqua bar. The dollar found its feet again this week with a string of strong blue “Go” bars also.
$SPY Paints Another Week of Strong Blue “Go” Bars
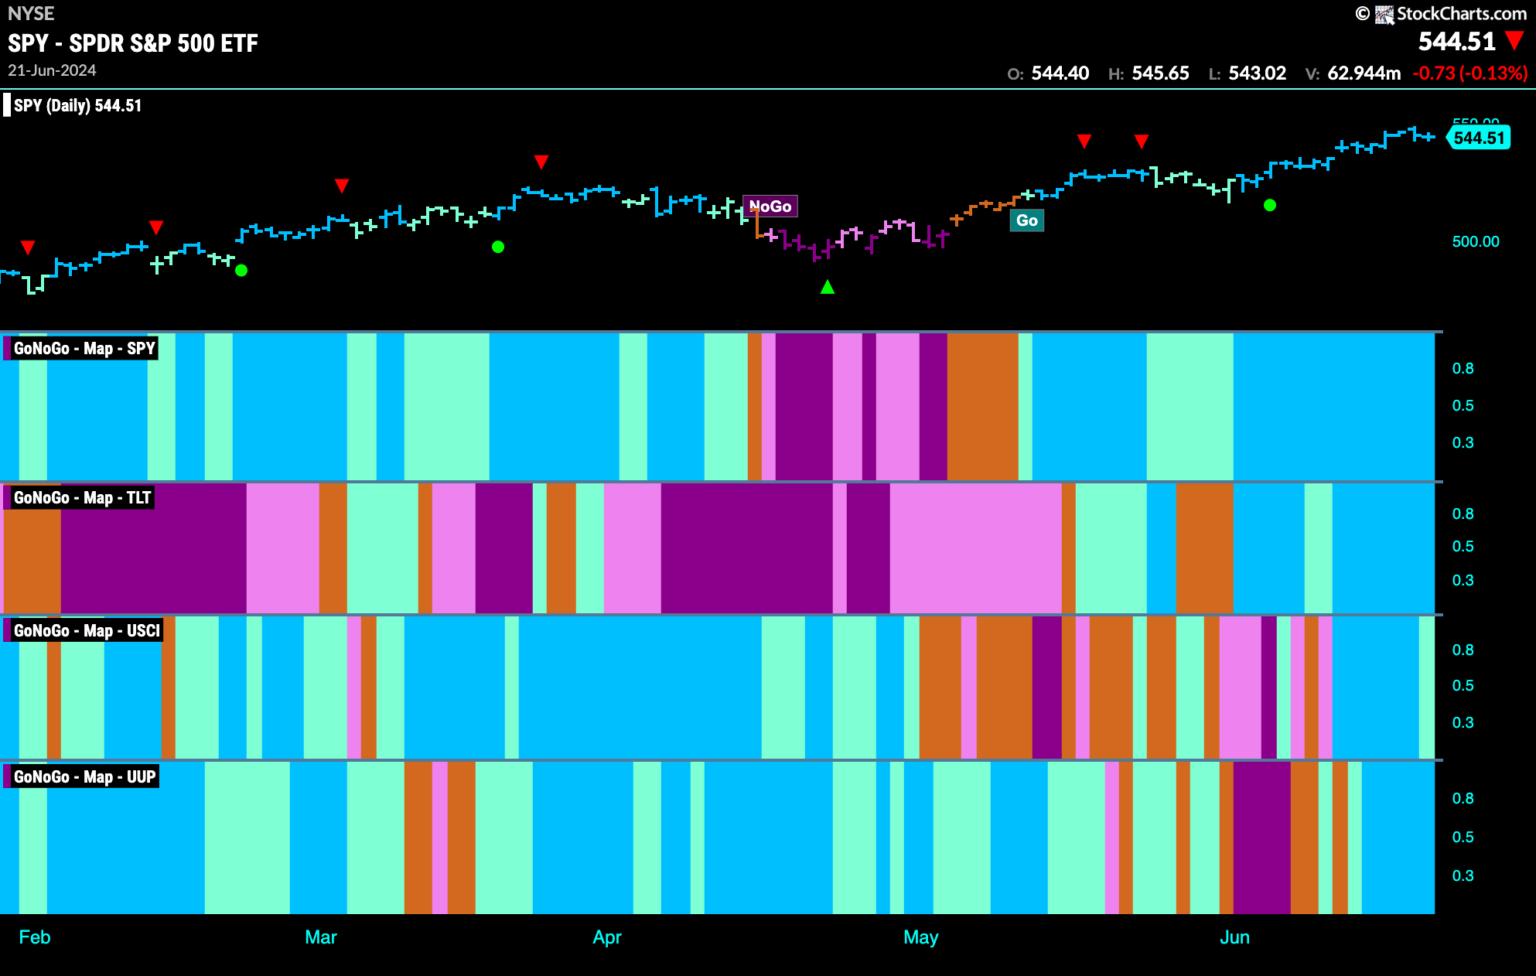
Price hit another higher high this week as GoNoGo Trend painted a string of strong blue “Go” bars. When turning our attention to the oscillator panel we see that it has remained overbought this week moving between values of 5 and 6. Volume is heavy with prices at these levels. we will watch to see if the oscillator falls out of the overbought range in the upcoming days. If it does, we will see a Go Countertrend Correction Icon (red arrow) above price indicating that it may be a struggle for price to go higher in the short term.
Another week another higher high! A 7th consecutive bright blue bar on the weekly chart as price continues higher. GoNoGo Oscillator has climbed into overbought territory at a value of 6. We will watch to see if it stays overbought or if it falls back toward neutral territory.
Treasury Rates Continue to Paint “NoGo” Bars
After a new low at the beginning of the week we saw strong purple “NoGo” bars as price consolidated and moved mostly sideways. GoNoGo Oscillator during this week stayed in negative territory but is not yet oversold and in fact turned up on the final bar of the week. With momentum in negative territory we can say that it is confirming the direction of the underlying “NoGo” trend.
Dollar Consolidates New “Go” Trend
Last week we saw a bullish engulfing pattern end the week on a fresh aqua “Go” bar with price again making a new higher high this week on strong blue bars. This comes as GoNoGo Oscillator appears to have solidified its position in positive territory and is moving further into positive territory at a value of 3.
The weekly chart shows continued strength with the latest bar painted strong blue and price at a new slightly higher high. We can see that price is now staying above highs from earlier in the chart. GoNoGo Oscillator has bounced off the zero line and is back in positive territory. With momentum rising and in the direction of the underlying trend we will look to see if price can go higher still.


