


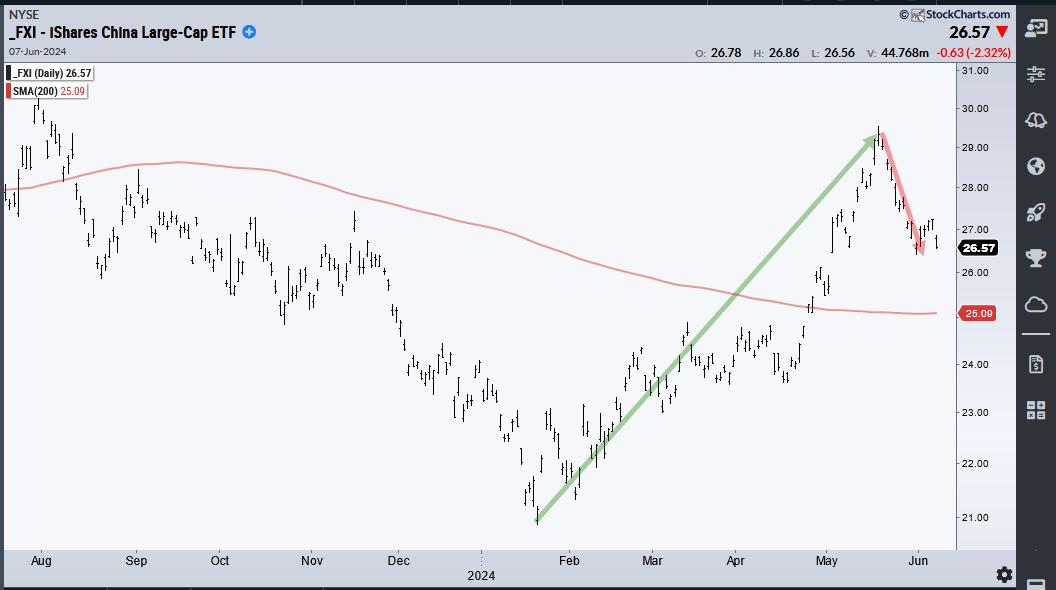
Chinese stocks wet on a tear from mid April to mid May with the China Large-Cap ETF (FXI) gaining some 40% and breaking its 200-day SMA. FXI then fell back over the last few weeks. This surge and pullback created a potential opportunity because some stocks returned to their breakout zones. These so-called throwbacks offer traders a second chance to partake in the breakouts. Today’s example will show Alibaba (BABA), which was featured on ChartTrader this past week.
The chart below shows Alibaba with the 200-day SMA (red line) and the Trend Composite in the indicator window. On the price chart, BABA found support twice in the 67-68 area and broke resistance with a surge in May. The two lows in this area formed a Double Bottom and the breakout reversed the downtrend. Also notice that BABA broke the 200-day SMA.
Traders who did not catch the breakout have a second chance because BABA returned to the breakout zone in early June. This is a classic “throwback” to broken resistance, which turns into support. The stock also returned to the 200-day SMA and the decline retraced around 61.8% of the prior surge. This retracement is normal for a pullback within a bigger uptrend. Overall, I see a Support-Reversal Zone in the upper 70s and I am watching short-term resistance at 80. A breakout here would reverse the short-term downswing and argue for a resumption of the bigger uptrend.
As noted above, the indicator window shows the Trend Composite, which aggregates signals in five trend-following indicators. It moved to +1 in early May, which meant three of the five indicators triggered bullish signals (3 – 2 = +1). Two more indicators turned bullish by the end of May and all five are now bullish (+5). My strategy is to look for tradable pullbacks within bigger uptrends. The Trend Composite signals a long-term uptrend and the decline to the upper 70s is a tradable pullback. Note that this indicator is part of the TIP Indicator Edge Plugin for StockCharts ACP (click here).
ChartTrader at TrendInvestorPro featured BABA and two other Chinese names last week. Recent breakouts in several crypto-related names were also featured because their breakouts signaled a continuation of their bigger uptrends (IBIT, COIN, BLOK). Reports and videos are published twice per week. Click here to learn more.
//////////////////////////////////////////////////


