On inflation
I like this quote-
“Goods deflation likely transitory as downward pressure on goods demand and input costs are fading. 1H24 global core inflation likely to settle near 3%, which won’t resolve the immaculate disinflation debate.”
And this quote does not include the steep rise in shipping costs of late.
Note the move in costs as of early December was at yearly lows. One month later, the costs are at yearly highs.
Super cycles don’t just fade away; they cycle with volatility and passion, just like the word super suggests. 40% up or down price moves in commodity related instruments is not unusual, and very much like we saw in the 1970s.
Commodities will flatline when inflation is over, just like they did for so years before 2020, We do not expect that to happen until mid-2025 to early 2026.
The issues for sticky inflation:
It’s globalThere are still shortages of basic raw materialsDemand not as weak as folks thoughtGeopoliticsWeather concernsFED might not lower rates, but they won’t raise them either. Furthermore, so far, many commodities are not concerned with the dollar or rates — any misstep by the Fed can send commodity pricing soaringRecent job and ISM reports are deceptive. There were significant drops in employment and new orders, while prices paid remain quite elevated showing that inflation remains sticky. Wages rose in December and are now back over 4%. Part of the strong labor numbers posted Friday is because the government hiring went up 5.2% this year
Disclaimer: There are no guarantees and of course, our Year of the Dragon might avoid any trips to Hell. But in case:
How will we know when inflation returns?
This could happen if:
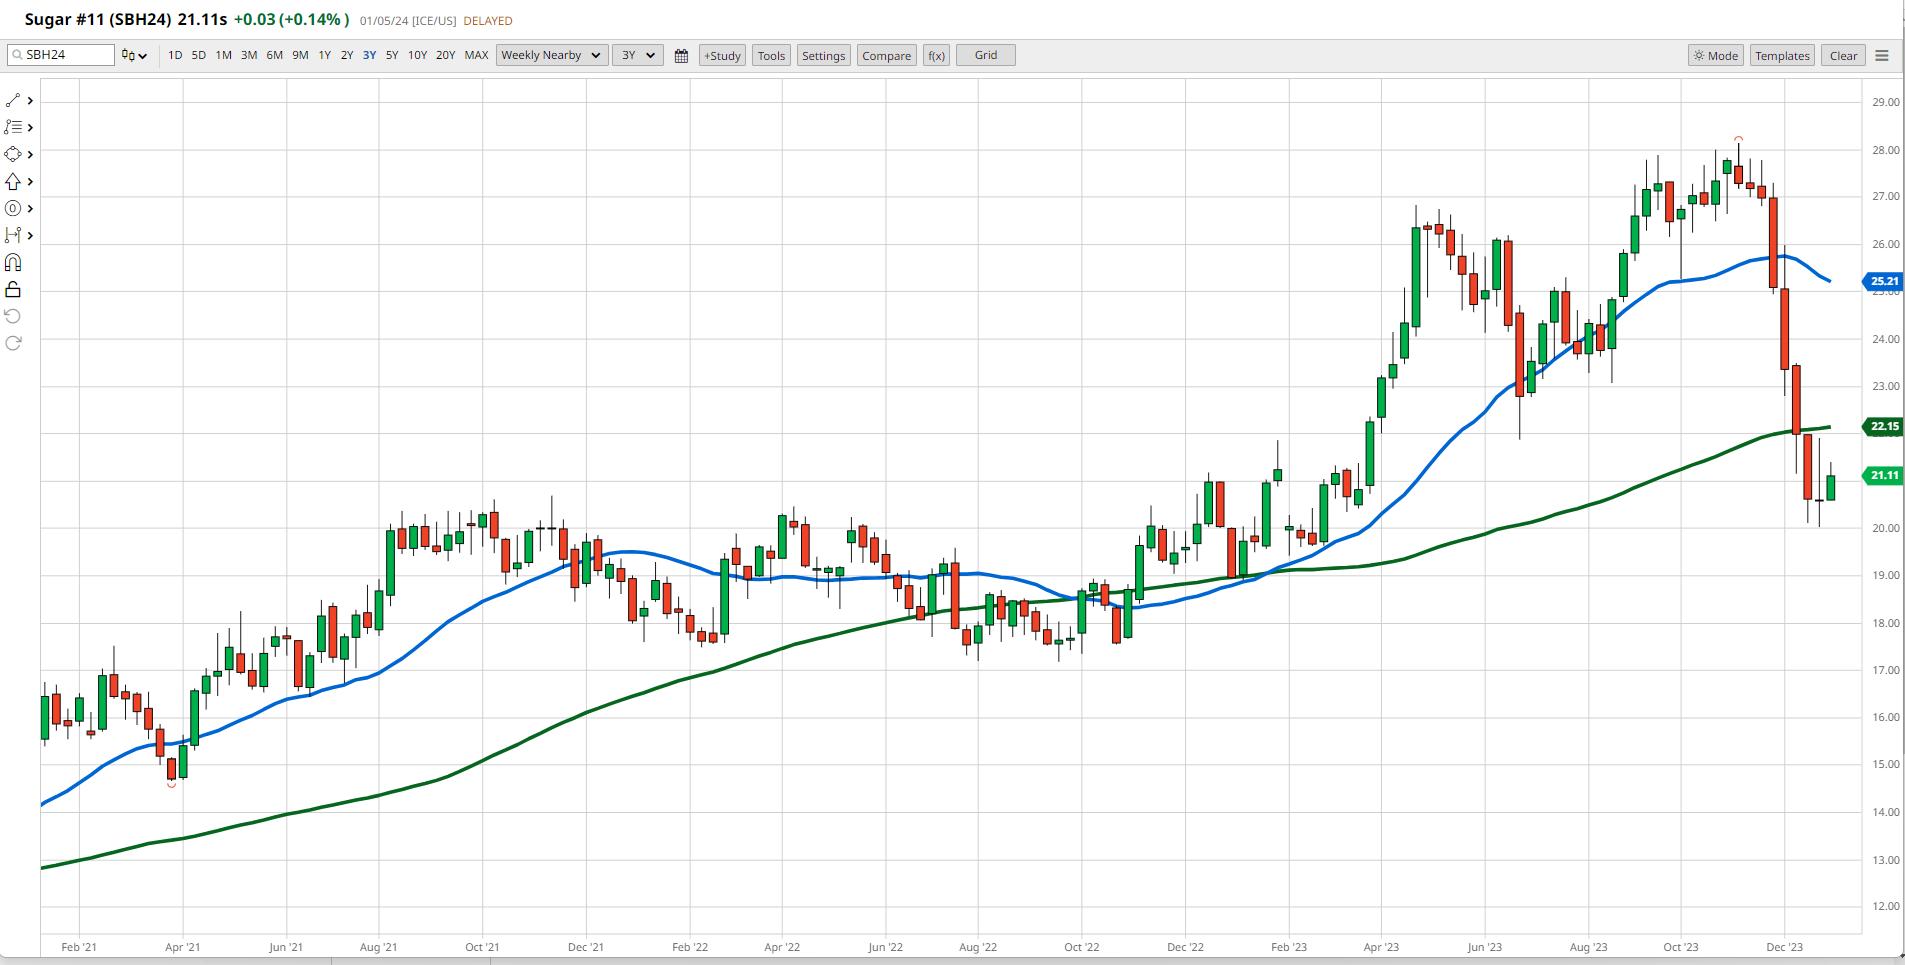
Dollar does something more dramatic.Silver starts to outperform gold.Sugar (perfect example of a super cycle type volatility) heads back over 22 cents
We expect the next wave to occur in late spring/summer 2024.
Looking at the sugar chart of the March contract, in March 2021 sugar traded at $.15.5 a pound. (In 2020, the price was $.06 a pound.) Since then, sugar spent most of late 2021 and most of 2022 consolidating. Then in February 2023, it took off, finally peaking at $.28 in November 2023.
That dramatic drop is exactly my point. This is what happened in the mid to late 1970s.
Sugar is still 4 times higher in price than in 2020. Should we see this return over the 200-daily moving average (green line) or over $.22, I would think that my favorite barometer is telling us something — at least, something about becoming too complacent in a world full of powder kegs.
Click this link to get your free copy of the Outlook 2024 and stay in the loop!
This is for educational purposes only. Trading comes with risk.
If you find it difficult to execute the MarketGauge strategies or would like to explore how we can do it for you, please email Ben Scheibe at Benny@MGAMLLC.com, our Head of Institutional Sales. Cell: 612-518-2482.
For more detailed trading information about our blended models, tools and trader education courses, contact Rob Quinn, our Chief Strategy Consultant, to learn more.
Get your copy of Plant Your Money Tree: A Guide to Growing Your Wealth.
Grow your wealth today and plant your money tree!
“I grew my money tree and so can you!” – Mish Schneider
Follow Mish on X @marketminute for stock picks and more. Follow Mish on Instagram (mishschneider) for daily morning videos. To see updated media clips, click here.
Mish in the Media
Mish and Maggie Lake discuss inflation (given the wage component in the payroll report), Bitcoin (given the looming deadline for ETF news), the market outlook, small caps, and emerging markets on this video from Real Vision.
Mish covers war, energy, food and a pick of the day on Business First AM.
On the Tuesday, January 2 edition of StockCharts TV’s The Final Bar, Mish (starting at 22:21) talks small caps, retail, junk, and why all three matter in 2024 a lot.
In this appearance on BNN Bloomberg, Mish talks a particularly interesting chart, plus other places to invest in 2024.
In this appearance on Fox Business’ Making Money with Charles Payne, Mish talks with Cheryl Casone about Bitcoin’s volatility and why EVs may not be such a great place to invest in right now.
Recorded on December 28, Mish talks about themes for 2024 to look for, and tells you where to focus, what to buy, and what to avoid depending on economic and market conditions on Singapore Breakfast Bites.
Mish sits down with 2 other market experts to help you prepare for 2024 with predictions, picks, and technical analysis in StockCharts TV’s Charting Forward special.
Recorded December 27, Mish gives you a quick snippet of the overall macro prediction for 2024 on The Street with J.D. Durkin.
Coming Up:
January 22: Your Daily Five, StockCharts TV
January 24: Yahoo! Finance
Weekly: Business First AM, CMC Markets
ETF Summary
S&P 500 (SPY): 480 all-time highs, 460 underlying support.Russell 2000 (IWM): 195 pivotal, 180 major support.Dow (DIA): Needs to hold 370.Nasdaq (QQQ): 390 major support with 408 resistance.Regional banks (KRE): 47 support, 55 resistance.Semiconductors (SMH): 160 major support and 170 now resistance to clear.Transportation (IYT): Needs to hold 250.Biotechnology (IBB): 130 pivotal support.Retail (XRT): 70 now key and pivotal.
Mish Schneider
MarketGauge.com
Director of Trading Research and Education


