


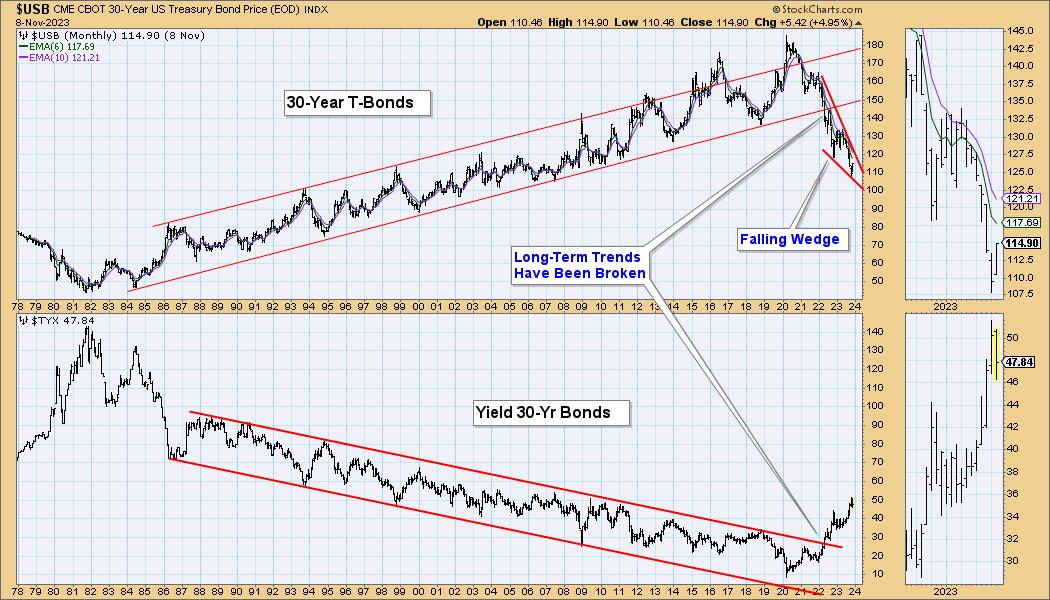
After making a major low in 1981, bonds entered a rising trend that lasted nearly 40 years. During that period, new rules and expectations were constructed and acquired that still influence decision making today — which is unfortunate, because the game has changed.
In 2022, the long-term rising trend line was broken, and the technical implication is that bonds will continue to trend downward for many years to come. That downtrend will not, however, proceed without some relief, and such a relief rally seems to be in the immediate future.
You will note that a falling wedge has formed, and the most likely resolution of that formation is an upside breakout. This is a long-term chart, so the rally will probably last for several months, during which time the rules and expectations of the now defunct 40-year rising trend will be reinforced, setting up the bulls for failure when the downtrend resumes. I should add the caveat that my conclusion depends upon this month’s price bar not making new lows. Nevertheless, a relief rally will ultimately take place, later if not sooner.
Conclusion: Bonds have broken a long-term rising trendline, and have entered a down trend that will probably last for years. Failing to recognize this change will be costly.
Learn more about DecisionPoint.com:
Watch the latest episode of DecisionPoint on StockCharts TV’s YouTube channel here!
Try us out for two weeks with a trial subscription!
Use coupon code: DPTRIAL2 at checkout!
Technical Analysis is a windsock, not a crystal ball. –Carl Swenlin
(c) Copyright 2023 DecisionPoint.com
Disclaimer: This blog is for educational purposes only and should not be construed as financial advice. The ideas and strategies should never be used without first assessing your own personal and financial situation, or without consulting a financial professional. Any opinions expressed herein are solely those of the author, and do not in any way represent the views or opinions of any other person or entity.
DecisionPoint is not a registered investment advisor. Investment and trading decisions are solely your responsibility. DecisionPoint newsletters, blogs or website materials should NOT be interpreted as a recommendation or solicitation to buy or sell any security or to take any specific action.
Helpful DecisionPoint Links:
DecisionPoint Alert Chart List
DecisionPoint Golden Cross/Silver Cross Index Chart List
DecisionPoint Sector Chart List
Price Momentum Oscillator (PMO)


