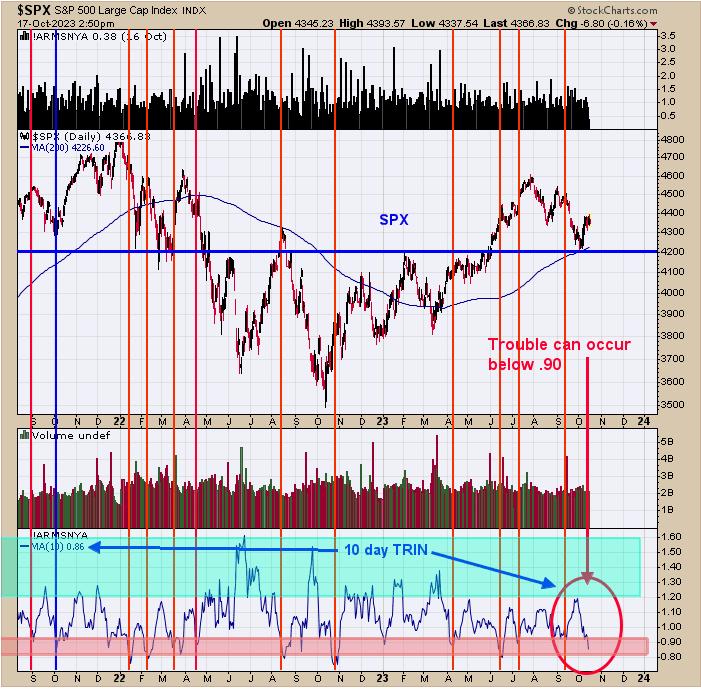
SPX Monitoring purposes: Long SPX 9/28/23 at 4299.70.
Gain since 12/20/22: 15.93%.
Monitoring purposes GOLD: Long GDX on 10/9/20 at 40.78.
In the above chart, the bottom sub-panel displays the 10-period moving average of the TRIN. The shaded pink areas are when this indicator leans bearish (below 0.90) and light blue when it leans bullish (above 1.20). The current 10-day TRIN stands at 0.86 and leans bearish. We noted with red lines the times when this indicator was below 0.90.
During October option expiration (this week) seasonality leans bullish, and it’s possible that Option Expiration bullish lean may trump the bearish lean 10-day TRIN for a short while. There is a possibility a pullback may be coming but it may come after option expiration week; having said that, we do expect higher prices going into yearend.
Long SPX 9/28/23 at 4299.70. Join me on TFNN.com Tuesday 3:30 Eastern; Thursday 3:20 Eastern, Tune in.
We have been saying, “The bottom window is the NYSE Advancing issues/NYSE Total issues with a 10-period average. A “Zweig Breadth Thrust” occurs when this indicator drops below 0.40 than rallies to 0.60 within ten days. We pointed out the previous “Zweig Breadth Thrust” in the past with blue dotted arrows. There were three “Zweig Thrusts” in the basing period from April 2022 to April 2023. When a “Zweig Thrust” occurs, it suggests a bullish intermediate-term rally is coming. The 10-day count down starts from last Thursday when the “Zweig Breadth Thrust” closed at 0.40. The 10-day count down to 0.60 on the “Zweig Breadth Thrust” would be October 19 or sooner. The current reading is 0.49; and almost halfway there. The current rally would need to continue to push the “Zweig Thrust” higher. I’m thinking it’s possible.” The current reading is 0.52 up from yesterday of 0.51, and still has Thursday for 0.60 to be reached to trigger the “Zweig Breadth Thrust”.
The bottom panel in the above chart is the weekly GDX cumulative Advance/Decline Percent Indicator. The panel above it is the weekly GDX cumulative Up Down Volume Percent. The weekly indicators look at the bigger picture and the signals can last two to six months. A signal is triggered when one or both indicators close above its mid-Bollinger band. The blue circles identify when either indicator crossed above its mid-Bollinger band. At the moment, we have both. These indicators are good at catching trends that last two to six months. The previous signal came in April around the 34.00 range on a sell and now has turned bullish near the 29.00 range.
Tim Ord,
Editor
www.ord-oracle.com. Book release “The Secret Science of Price and Volume” by Timothy Ord, buy at www.Amazon.com.
Signals are provided as general information only and are not investment recommendations. You are responsible for your own investment decisions. Past performance does not guarantee future performance. Opinions are based on historical research and data believed reliable; there is no guarantee results will be profitable. Not responsible for errors or omissions. I may invest in the vehicles mentioned above.


