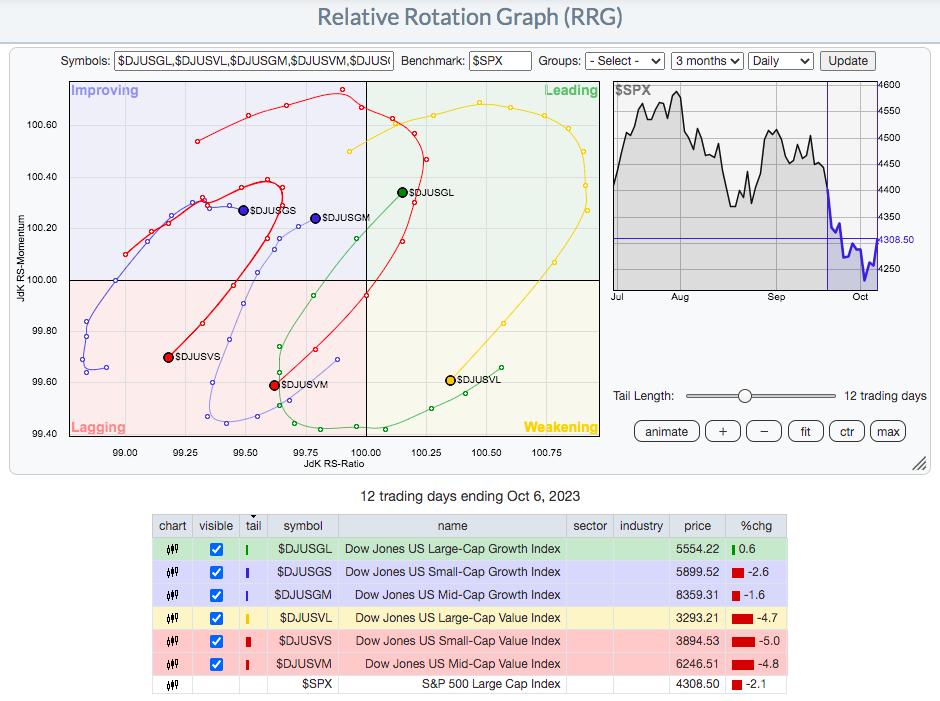
One thing I repeatedly talk about is ignoring the talking heads and following the charts. If I had to provide a chart as the “poster child” for this, I might start with the following RRG chart:
We’re downtrending, right? We’re heading back to the 2022 low and maybe further, right? Inflation remains a problem, right? The 10-year treasury yield ($TNX) is nearly 5%, right? Earnings will slow, right? Here comes a recession, right? And the government is inevitably gonna shut down, right? Blah, blah, blah, blah, blah, blah….
I see it and hear it everywhere I go. And you know how I respond? By tuning it all O-U-T. I let the charts do the talking and the RRG chart above is screaming at us. RRG provides us an excellent source to see what’s happening “beneath the surface”. I deliberately put 12-day “tails” on RRG, because it’s been 12 days since Fed Chief Powell was yapping about “higher rates for longer”. You know what, Wall Street doesn’t care – at least not with their money! I don’t know what is being said on CNBC, because I won’t watch it. But look at the rotation on the RRG chart. The growth indices at the large cap, mid cap, and small cap levels are ALL moving in bullish fashion. The value indices are doing the opposite.
Want to see a SharpChart that illustrates the same point in a little different format?
Could this rotation to aggressive growth stocks be any clearer? Over the past two weeks, what have you heard on CNBC? (Asking for a friend). After Wall Street filled their coffers with growth stocks the past two weeks, while selling us garbage on CNBC and elsewhere, the stock market explodes on Friday – and after a HOT jobs report. Do you honestly believe CNBC is reporting the NEWS? Because, to me, this MASSIVE rotation to growth the past two weeks should be the top story. It sickens me.
Listen, nothing guarantees us which way the stock market is heading. Absolutely nothing. I’ve been wrong before and I’ll be wrong plenty of times in the future. But being right 100% of the time isn’t my goal. My goal is to effectively manage risk. Sorry, but I’m not buying the gloom and doom when I see the above RRG chart and SharpChart.
Folks, I’m a former practicing CPA and I was involved in valuations. Stock valuations drop FASTER on growth stocks when interest rates are truly expected to move higher. If everything else is equal, rising rates cause the value of future earnings to drop. Period. And growth stocks are valued primarily based on their growth prospects. So explain to me how the Fed’s talking about “higher rates for longer” should lead to a massive rally in growth stocks since the moment the Fed announcement was made.
I now do a very detailed Weekly Market Report for our members. If you want quality research and education to help you better manage your own investments, I encourage you to try our service at EarningsBeats.com. We have a 30-day FREE trial and I’ll help guide you through the next month. In this week’s Weekly Market Report, I’ll be providing two charts that are absolute bear market KILLERS. Check out our service for 30 days and then be the judge of the incredible value we provide. Not ready for the paid service? Then CLICK HERE and enter your name and email address to become a FREE subscriber to our 3x per week EB Digest newsletter.
Happy trading!
Tom


