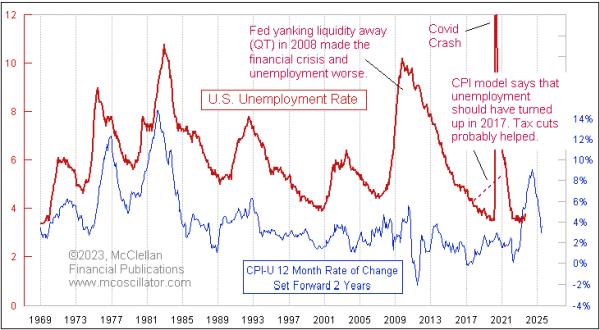
Back in March 2023, I wrote a piece here titled, “Three Signs Employment Is Going to Take a Hit“. It looked at 3 different leading indication relationships that were all calling for a rise in the unemployment rate. This week’s chart takes a closer look at one of those, the message from the inflation rate.
The key insight for understanding this relationship is that the plot of the CPI inflation rate has been shifted forward by 2 years to reveal how the unemployment rate tends to follow in the same footsteps after that lag time. This chart frustrates a lot of classical economists, who believe what they were taught about the Phillips Curve. The Phillips Curve hypothesizes that high unemployment leaves people with less money to spend, and so the economy slows, which brings prices down, curing inflation.
That is the operating philosophy of the Federal Reserve, and it is wrong.
The real relationship is that high inflation brings high unemployment, and low inflation leads to lower unemployment 2 years later. So if you were in charge of the economy, and wanted to ensure maximum employment, what you should do is somehow arrange for zero percent inflation, and then just wait two years.
There have been instances when this model did not work as well. The COVID Crash is an obvious example. That event, and the government’s overwhelming stimulus response, broke a lot of economic models, and understandably so.
We can also see that the 2008-09 economic depression, which followed the so-called “Great Financial Crisis”, brought unemployment at a much higher rate than hinted at by this model. That came about because the Fed was overly aggressive in trying to undo the excesses of Greenspan’s final years as Fed chairman, when he kept rates too low, which fueled the housing bubble. Congress piled on by mandating “mark to market” accounting of distressed assets, which had a positive feedback effect, exacerbating the economic damage.
Even though the magnitude of the 2009 unemployment rate peak was higher than suggested, it did arrive on time according to this model, as did the economic recovery, which matched the waning rate of inflation 2 years before.
Another interesting anomaly came in 2017, when this model said that the unemployment rate was supposed to have bottomed and turned upward, but instead it kept declining all the way to Feb. 2020, when the COVID Crash disrupted the nice correlation. The tax cuts which were implemented in 2017 arguably had a big effect on business confidence, allowing the unemployment rate to keep falling in spite of inflation’s message, but at a cost of seeing the total federal debt rise by between $600 billion to $800 billion per year in 2017-2019. It rose a lot more in 2020 with all of the COVID spending.
Now, in 2023, the CPI spike 2 years ago is saying that we should be expecting a rise in the unemployment rate, but it is slow in getting started. The latest numbers for August showed a rise to 3.8%, up off of the low of 3.4% in January 2023. The CPI inflation rate peaked at 9.1% in June 2022, and so, if the 2-year lag time works perfectly, then that would mean a peak for the unemployment rate in June 2024. You can bet that unemployment will be a big topic in the upcoming presidential debates ahead of the November 2024 election.
The unknown part of this is how much response we will see in the unemployment rate, which is thus far being slow to start its rise. The extra post-COVID stimulus may have been responsible for keeping companies full of cash to keep on their employees, albeit at a cost of having the total federal debt rise by more than $2 trillion versus a year before.
The latest CPI data just released on Sep. 13, 2023 showed CPI rising 3.7% versus a year ago. This is not good news for the future employment prospects 2 years from now, once the 2-year lag time goes by. The Federal Reserve is not even reaching its illegal mandate of 2% inflation, despite raising rates up so high that it has effectively killed the real estate market.
I am not speaking lightly when I say that the Fed’s 2% inflation target is illegal. Most people, including Federal Reserve staffers, seem unaware that Congress passed an actual statute back in 1978 mandating that once the inflation rate got back down below 3%, then the Fed’s inflation target rate would be “zero per centum”.
Now admittedly, it is tough to expect the Fed to accomplish that using the limited tools it has, especially when Congress goes throwing around so much deficit spending to “help” the economy. In that circumstance, it is not the Fed’s proper role to adjust its own target illegally to 2% (which it is still not meeting). If Congress is mandating a target that the Fed cannot meet because of Congress’ own deficit spending, then the proper action is for the FOMC members to either ask Congress for a different target, or tell Congress that they cannot comply with that law and must resign. I don’t expect that to happen any time soon.
But next time you hear anyone talking about “the Fed’s 2% inflation target”, please kindly inform such people that, by statute, the Fed’s statutory target is actually zero. And if we could actually get inflation down to 0%, then that would be good for the jobs market, 2 years later.


