The market’s August slump deepened this past week, with each of the major Indexes dropping more than 2% as Treasury yields hit a 15-year high. That said, today’s price action could signal the start of a rally attempt, after the broader markets closed in the upper half of their trading range for the day on decent volume.
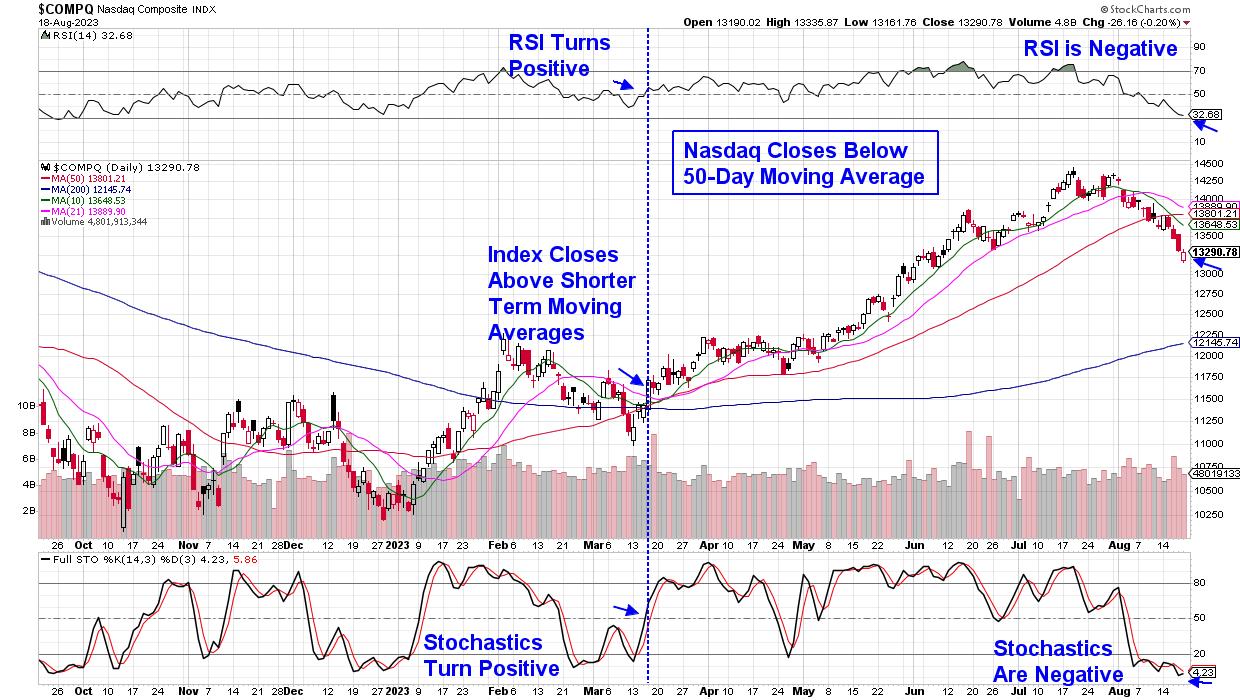
One day does not make a market, however, and in the chart below I’ve highlighted the characteristics needed to fully signal that a new uptrend is in place. As you’ll see, a close of the markets back above resistance with positive momentum indicators is key. Other factors will also be needed, particularly for the Nasdaq, as this tech-heavy Index is filled with Growth stocks, which fare poorly in a rising interest rate environment. Using the 10-year Treasury bond, we’ll need yields to fall back below 4%, at the very least.
Daily Chart of Nasdaq Composite Index
Bond yields may have room to rise further, however, as they tend to peak just before the Federal Reserve reaches the end of their rate hike cycle. Next week should provide further clues on monetary policy, as Fed Chair Powell will make his annual speech at Jackson Hole next Friday.
Before then, leading chip provider Nvidia (NVDA) will be releasing earnings on Wednesday after the market’s close. The company’s previous report sparked a sharp rally in Semiconductor stocks, which began in late May on news of outsized demand for their AI chips. NVDA’s comments regarding growth prospects going forward will be closely watched; however, investors’ response to the news will be more telling. If the stock moves sideways or trades lower despite positive news, it will signal the continuation of a risk-off sentiment, similar to last week’s decline, despite news of a more advanced AI chip due out next year.
Whether the markets turn positive over the next week or not, investors should be building their watchlist in anticipation. From my work, this list will include high-quality stocks which have pulled back despite posting strong earnings and sales or guiding growth higher into next year. I’d advise sorting your list by sector as well, so that when group leadership is revealed, you’ll be better prepared. According to a study by famed investor Wiliam O’Neil, Sector and Industry Group affiliation of your stock accounts for almost 50% of your stock’s price appreciation or deterioration.
While Microsoft has recently pulled back due to reporting weak earnings, I’ve included the chart below to share with you the signals that indicated a new uptrend that took place in mid-March. As you may recall, interest rates began to decline at that time.
Daily Chart of Microsoft (MSFT)
For those who’d like to be alerted to the new uptrend in the markets when it takes place and to also have access to my highly curated watchlist, use this link here to gain immediate access to recent reports. You’ll also receive buy ideas as stocks are added to the Suggested Holdings List as well. This list alerted subscribers to Nvidia (NVDA) in January, as well as other leading Semiconductor stocks that went on to far outpace the markets.
Warmly,
Mary Ellen McGonagle, MEM Investment Research


