


2023 has seen a significant thrust in tech names. The recent run in semiconductor and software stocks are great examples of market thrusts. The market has split into different vehicles, and we are currently riding the AI vehicle to higher highs.
One of the tools I like to use to analyze stocks and indexes for momentum is the PPO.
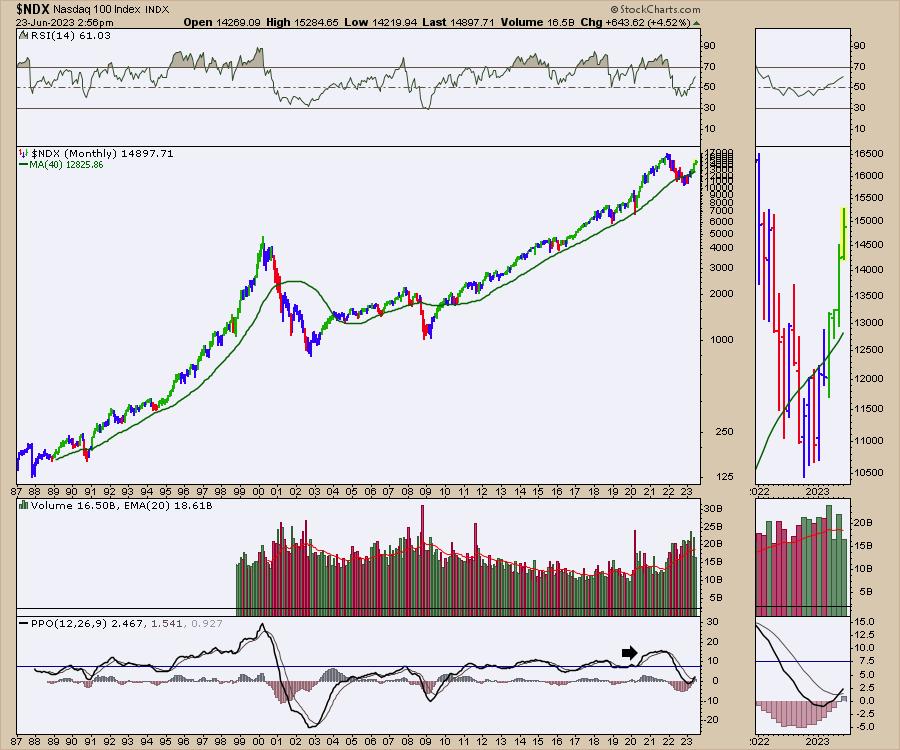
Back in 2021, the $NDX index had a PPO surging to very high levels on the monthly chart. It was the highest level in 20 years, and suggested caution. When it rolled over, it was quite important to respect that. The PPO turned up to a buy signal this month, so that looks more bullish.
When I look at the mega-cap tech names, some of the charts are ramping up nicely, like TSLA. The weekly PPO is surging, and this looks like it could run to much higher levels. There is not a limit for the PPO, but when it rolls over on a weekly chart, it can be a clue to be more protective of gains.
When I look at MSFT, the PPO is significantly higher compared to history. Only in 2010 (which was after a major bottom) have we reached this level of momentum in this century. We are testing the prior high, so it’s probably a good place to be cautious. Nothing wrong with waiting for MSFT to give a little pullback.
Looking at NVDA, we have a significant surge as well. This is higher than anything since the turn of the century! The volatility of NVDA back in 2000-2002 gave you great trading opportunities. The real opportunity was in taking profits at high levels. That does not mean sell your stock here, but it does suggest having a plan for protecting profits.
What it suggests to me is that some of these charts are too extended for new positions. Feel free to analyze other mega-cap names for where they are relative to history. I had 46 charts on the $SPX with high PPOs, but that is only 10% of the index. Some are still rising, some are cresting, and some are well on their way lower.
It’s only been one week of selling, but it is important to recognize that these charts might be ready for a bigger breather.
If you like the work we do, feel free to go over to OspreyStrategic.org and consider a $7 one-month trial. I’ll be detailing some other indicators in the weekend newsletter. Enjoy the week.


