Tuesday’s Daily was all about the metals. On Wednesday, gold, miners, and silver all rallied.
Is the bottom in on this last correction? Perhaps.
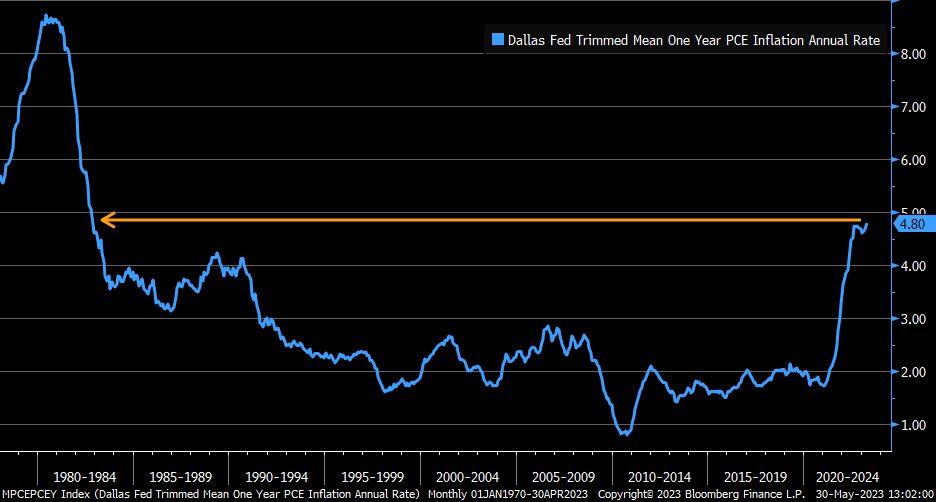
Two interesting areas to watch now are the one-year PCE rate-adjusted. And the retail sector is now on critical lows. In other words, we can see stagflation maturing before our very eyes.
The PCE is at levels close to a breakout over the 1980-1984 levels. That is the Fed’s go-to indicator. However, Granny Retail is super close to the precipice of a major breakdown under the 80-month moving average or 6-8 year business cycle.
The Fed’s playing pickle ball. The last time we saw a breakdown under that moving average (if XRT fails it) was KRE Regional Banks in March.
Can XRT hold here?
The Consumer Sector ETF XRT Has Some Words for You, and here they are.
First, the test of the 80-month MA (green and price 56.24) on the last day of the month of May is mad interesting.
Secondly, do not assume it will fail until it does. And, even if it fails that MA, June has 30 days before we can determine what happens the second half of the year.
Thirdly, XRT could just as easily hold that level, offering a very low risk/reward trade or, more importantly, a relief for the rest of the Economic Modern Family and market.
Fourth, XRT is below the March 2023 lows but above the October 2022 lows at 55.32.
Finally, on the Daily chart, momentum is declining. In fact, our Real Motion indicator shows that XRT’s momentum HAS NOT been below a key Bollinger Band until NOW. Not in March and not last October.
Mean reversion potential? Sure. But also, fair warning that the consumer sector is yet another potential harbinger that the lower trading levels in SPY going back to March and/or October are not to be dismissed.
For more detailed trading information about our blended models, tools and trader education courses, contact Rob Quinn, our Chief Strategy Consultant, to learn more.
“I grew my money tree and so can you!” – Mish Schneider
Get your copy of Plant Your Money Tree: A Guide to Growing Your Wealth and a special bonus here.
Follow Mish on Twitter @marketminute for stock picks and more. Follow Mish on Instagram (mishschneider) for daily morning videos. To see updated media clips, click here.
Mish in the Media
Mish explains how reversal patterns could come to the fore this week in this appearance on CMC Markets.
Mish joins Rajeev Suri of Orios Venture partners to discuss the possibility of economic stagflation in this video on LinkedIn.
Mish discusses how AI is being used to invest in this article for BNN Bloomberg.
Mish joins Rajeev Suri of Orios Venture Partners to discuss the implications of the debt ceiling deal in this video on LinkedIn.
Mish discusses the commodities to watch in this video from CMC Markets.
In this appearance on Business First AM, Mish covers business cycles, plus where to go for trades once the dust settles.
Mish and Caroline discuss profits and risks in a time where certain sectors are attractive investments on TD Ameritrade.
Powell eyes a pause, Yellen hints at the need for more rate hikes, and debt ceiling talks face challenges… what a way to end the week, as Mish discusses on Real Vision’s Daily Briefing for May 19th.
Mish walks you through the fundamentals and technical analysis legitimizing a meme stock on Business First AM.
Coming Up:
June 1st: Wolf Financial Twitter Spaces 1pm ET
June 2nd: Yahoo Finance
ETF Summary
S&P 500 (SPY): 23-month MA 420, the dance.Russell 2000 (IWM): 170 support, 180 resistance.Dow (DIA): 327-333 trading range for the week to hold or break.Nasdaq (QQQ): Not as strong a reversal top as SMH-b/c of APPL strength, but worth noting nonetheless.Regional banks (KRE): 35-42 range to watch.Semiconductors (SMH): Reversal pattern top; a drop near 138 would be a decent correction.Transportation (IYT): Like to see this hold 220 this week.Biotechnology (IBB): 121-135 range.Retail (XRT): 56.00 the 80-month MA.
Mish Schneider
MarketGauge.com
Director of Trading Research and Education


