We’re at a potentially exciting juncture in the markets with bigger trend shifts shaping up that you might find surprising. With all the talk about sticky inflation, an uncertain interest rate outlook and recession fears amid tightening of bank lending, it’s easy to throw your arms up in frustration. Today, I’m going to help you focus on the bigger picture instead, by sharing sector, industry group and broader market insights that will help lessen the noise and prepare you to take advantage of what’s unfolding for the second half of this year.
To do that, we’re going to use longer term, monthly charts as a guide. These charts remove the gyrations seen in daily charts and will often signal bigger trends that are longer lasting. My work is all about capturing sector rotation and if you haven’t seen my video on this subject from last year titled Understanding Sector Rotation, use this link here.
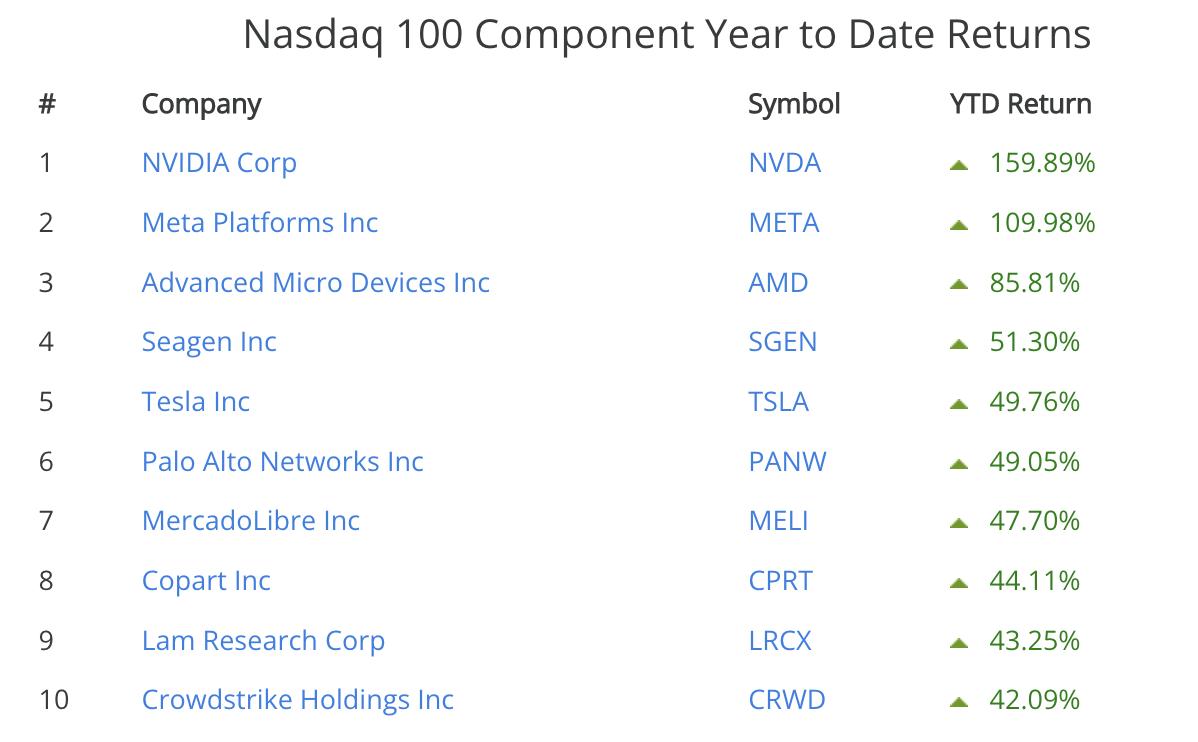
Below we’ll review a monthly chart of the Nasdaq which has been the leading Index year to date. While many investors will point to the narrow leadership among mega-cap stocks, take a look at the list below which has the performance of the Nasdaq 100 ranked by year-to-date performance. As you’ll see, Alphabet (GOOGL) and Amazon (AMZN) did not make the top 10. In fact, Apple (AAPL) did not even make the top 20 and Netflix (NFLX) did not make the top 30. (Full list can be seen here.)
MONTHLY CHART OF NASDAQ COMPOSITE INDEX
As you can see in the chart above, the Nasdaq is entering a longer-term bullish phase with its RSI entering positive territory and the MACD on the verge of posting a positive crossover. In addition, this Index has closed above its key 6-month moving average which is now acting as support as opposed to resistance. If you examine the full list of year-to-date top performers, you’ll see that the list has a number of Software and Semiconductor stocks on it. Both of these charts are in similarly bullish positions (using SOXX and IGV respectively) and of the two, Software stocks are poised to contribute the most in outperformance as we head into year end. This is because they sold off the most during worst of the bear market in 2022 and depending on growth prospects going forward, they are poised to outperform. At this time, Security and Personnel related Software stocks are faring well as spending in these areas remains vibrant.
As for areas poised to underperform going into the latter part of this year, below is a monthly chart of Energy stocks. While the RSI has not entered negative territory, the MACD has posted a negative crossover while the sector is now below its 6 month moving average. Profit margins for many Energy companies are driven by the price of oil and a look at the monthly chart of Brent crude will show that a downtrend is very much in place.
MONTHLY CHART OF ENERGY SECTOR
These are only 2 of the 11 sectors in the market and I’ve highlighted them because they’re on the threshold of a major shift and also, they’re signaling moves that are in line with a lower interest rate environment. While yields on longer term Treasuries are currently trending higher, there’s anticipation that the Fed will not only cease their rate hike campaign, select economists are on the lookout for a rate lowering at year end to 4.75%.
While I anticipate volatility in the markets to remain until critical issues such as inflation and economic growth are revealed, longer term I’m on the lookout for a move into Technology and away from Energy and other areas that fare poorly in a lower interest rate environment such as Financials. In the meantime, I’m taking advantage of the current outperformance in AI related Growth stocks and I urge you to use this link so you can as well. My MEM Edge Report will provide buy alerts on Semiconductor and Software stocks already on our Suggested Holdings List and you’ll be alerted to new names as they’re added as well. Subscribers to this twice weekly report were alerted to Nvidia (NVDA) in January and the stock has gained over 80% since being added.
Enjoy the long weekend!
Warmly,
Mary Ellen McGonagle, MEM Investment Research


