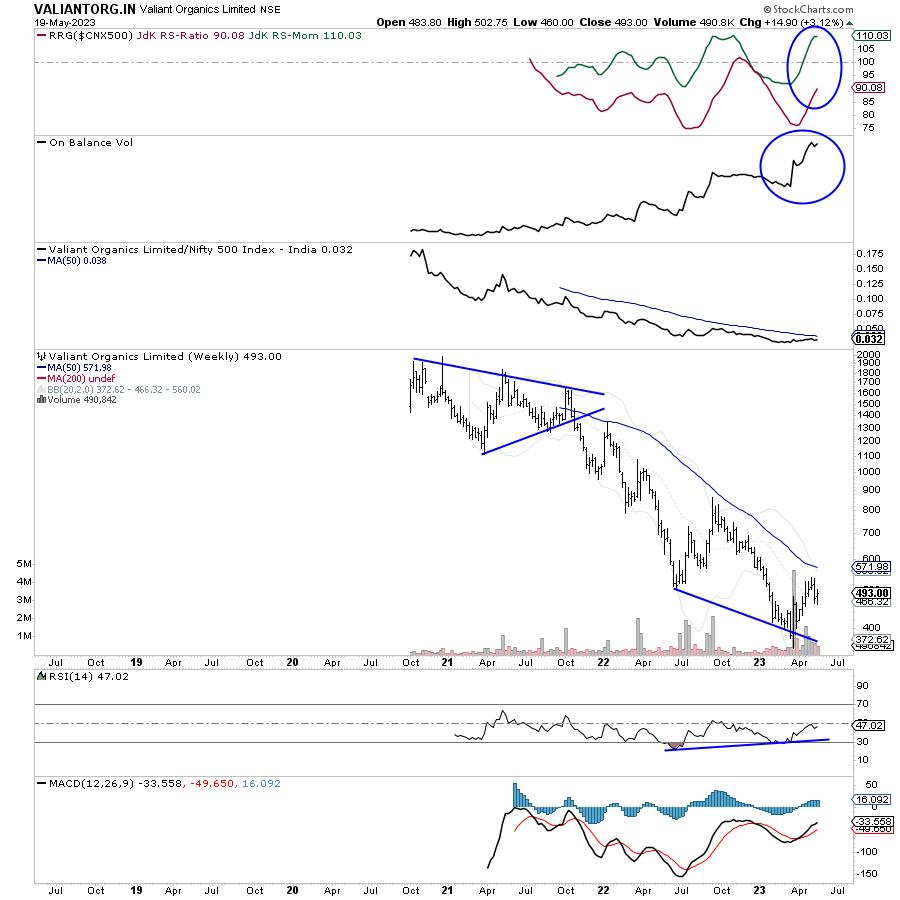
There is a compelling argument for a possible change in trend direction for VALIANTORG.IN.
The stock has a relatively brief listing history on the NSE. However, upon analyzing the weekly chart, it appears that after a significant decline, the stock might be in the process of reversing its trend.
VALIANTORG.IN became listed on the NSE in October 2020, resulting in the formation of a Symmetrical Triangle pattern in its price action. The stock broke down from this pattern and experienced a continuous decline until April of this year. From its peak at 1977 in December 2020, the stock dropped to a low of 355 in March of this year.
Several technical indicators on the chart suggest that the stock may have found a bottom. The recent phase of decline has coincided with a notable bullish divergence of the RSI in comparison to the price. While the price reached lower lows, the RSI formed higher bottoms, indicating a bullish divergence.
The On-Balance Volume has exhibited a significant spike and is currently trading near its highest point. This surge in volume suggests substantial accumulation of the stock during its recent decline. Furthermore, there has been a substantial increase in volumes near its lowest point, further indicating a potential bottom formation.
Presently, the stock is situated in the improving quadrant of the RRG, indicating a likelihood of better relative performance compared to the broader NIFTY 500 Index.
If the expected trend reversal occurs, the stock has the potential to experience significant price appreciation, potentially reaching levels between 800 and 875, especially when held for a medium to long-term time horizon. Given its current levels, it would be a favorable addition to an investment portfolio. However, if the stock slips below 355, it would invalidate this technical setup.
And
Milan Vaishnav, CMT, MSTA | Consulting Technical Analyst | www.EquityResearch.asia | www.ChartWizard.ae
Disclosure pursuant to Clause 19 of SEBI (Research Analysts) Regulations 2014: The analyst, Family Members, or his Associates holds no financial interest below 1% or higher than 1% and has not received any compensation from the Companies discussed.
The securities discussed and opinions expressed in this report may not be suitable for all investors, who must make their own investment decisions, based on their own investment objectives, financial positions, and the needs of specific recipients. This may not be taken in substitution for the exercise of independent judgment by any recipient.
The recipient should independently evaluate the investment risks. The value and return on investment may vary because of changes in interest rates, foreign exchange rates, or any other reason. Past performance is not necessarily a guide to future performance. The usage of the Research Reports and other Services are governed as per the Terms of Service at https://equityresearch.asia/terms-of-use
The Research Analyst has not managed or co-managed the issues of any of the companies discussed and has not received any such remuneration from such activities from the companies discussed.
The Research Analyst has not received any remuneration from the Merchant Banking activities.
The Research Analyst has adopted an independent approach without any conflict from anyone. The Research Analyst has not received any compensation or other benefits from the companies mentioned in the report or third parties in connection with the preparation of the research report.
Compensation of the Research Analysts is not based on any specific merchant banking, investment banking, or brokerage service transactions.
The Research Analyst is not engaged in a market-making activity for the companies mentioned in the report.
The Research Analyst submits that no material disciplinary action has been taken on him by any Regulatory Authority impacting Equity Research Analysis activities.
This report is not directed or intended for distribution to, or use by, any person or entity who is a citizen or resident of or located in any locality, state, country, or other jurisdiction, where such distribution, publication, availability, or use would be contrary to law, regulation or which would subject the Research Analyst to any registration or licensing requirement within such jurisdiction.


