Connect with us

Hi, what are you looking for?

Stocks

May Begins A Very Strong Period For Growth Stocks

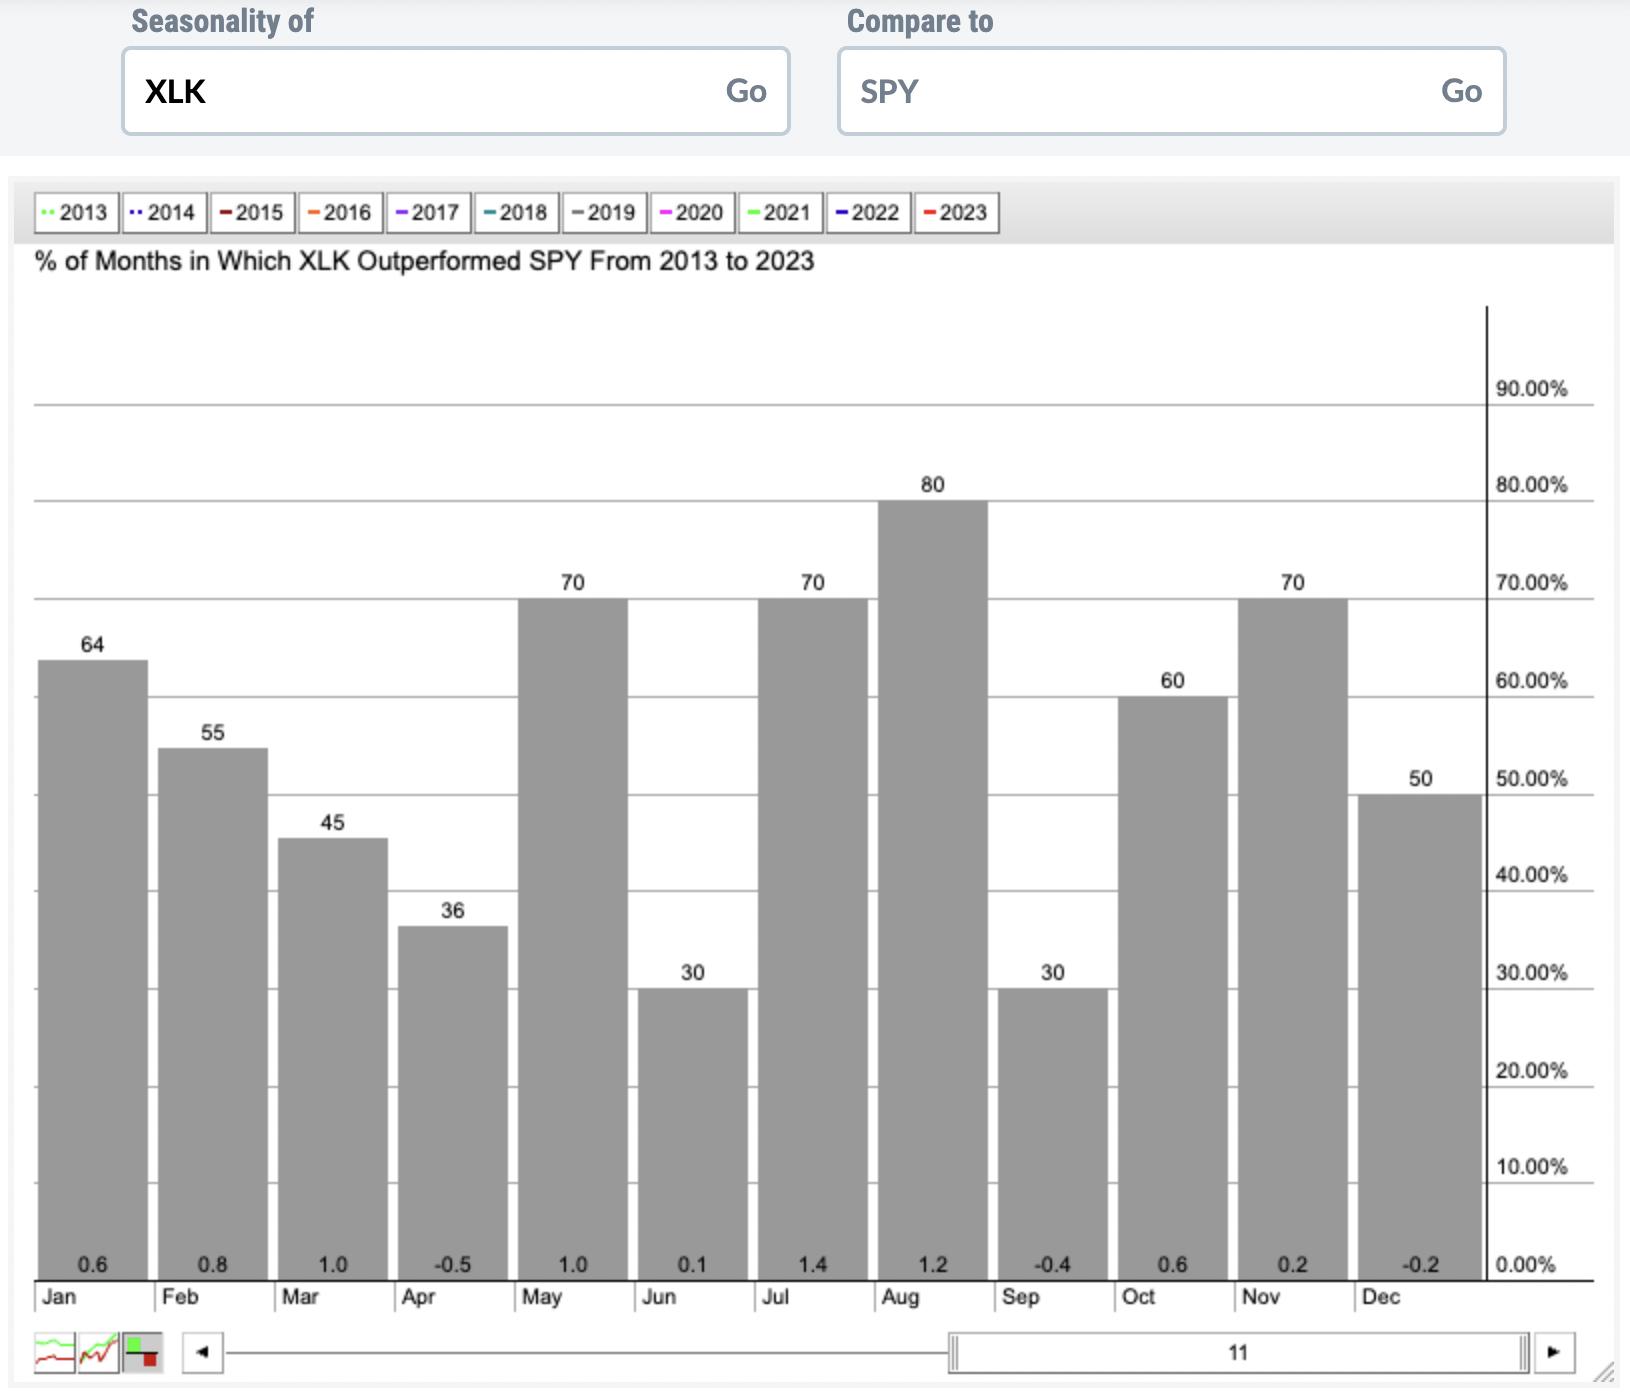
Growth-oriented stocks tend to have their best relative showing vs. value-oriented stocks beginning in May and running through August. Check out the relative seasonal performance of the XLK (vs. the SPY) over the next four months:

If you add the bottom numbers of each calendar month (represents average monthly outperformance of XLK vs. SPY since 2013), it totals 5.8%. That means that the XLK has averaged outperforming the SPY by 5.8% per year since this secular bull market began in 2013. If you add up just the four months from May through August, you’ll find that it totals 3.7%. That means that 60% of the XLK’s relative outperformance occurs during just 33% of the year (May through August). Technical indications suggest the market is going to head higher, led by technology. Seasonality supports this notion.

I’ll be providing solid trade setups throughout the May-August period in our FREE EB Digest newsletter. If you’d like to subscribe, simply enter your name and email address HERE. I’m planning to share a current favorite setup in tomorrow morning’s EB Digest.

Happy trading!

Tom Bowley, Chief Market Strategist, EarningsBeats.com

    You May Also Like

    Politics

    When George Santos mentioned his family during his congressional campaign, the New York Republican often reflected on the work ethic and strength of his...

    Business

    Two of Sam Bankman-Fried’s top business partners — a co-founder of the cryptocurrency exchange FTX and the former CEO of the hedge fund Alameda...

    Sports

    Kicker Alejandro Mata is following former Tigers coach Deion Sanders to Colorado. ‘Thankful to be committed and signed to the University of Colorado,’ Marta wrote on...

    Stocks

    SPX Monitoring Purposes: Sold long SPX 1/27/23 at 4070.56 = Gain 6.51%; Long on 12/20/22 at 3821.62. The top window is the cumulative GDX...

    Disclaimer: SecretCharts.com, its managers, its employees, and assigns (collectively “The Company”) do not make any guarantee or warranty about what is advertised above. Information provided by this website is for research purposes only and should not be considered as personalized financial advice. The Company is not affiliated with, nor does it receive compensation from, any specific security. The Company is not registered or licensed by any governing body in any jurisdiction to give investing advice or provide investment recommendation. Any investments recommended here should be taken into consideration only after consulting with your investment advisor and after reviewing the prospectus or financial statements of the company.

    Copyright © 2024 SecretCharts.com | All Rights Reserved