Admittedly, numbers are sexy.
Think about how much focus all the economic stats that came out this past week got on all media. Each one was the defining one for the markets and economy, according to the talking heads.
CPI and PPI softer? That’s it, inflation is over.
Retail Sales softer? That’s it, here comes recession.
FOMC hawkish (sort of, a bit unclear)? That’s it, FED will hike again, then pause.
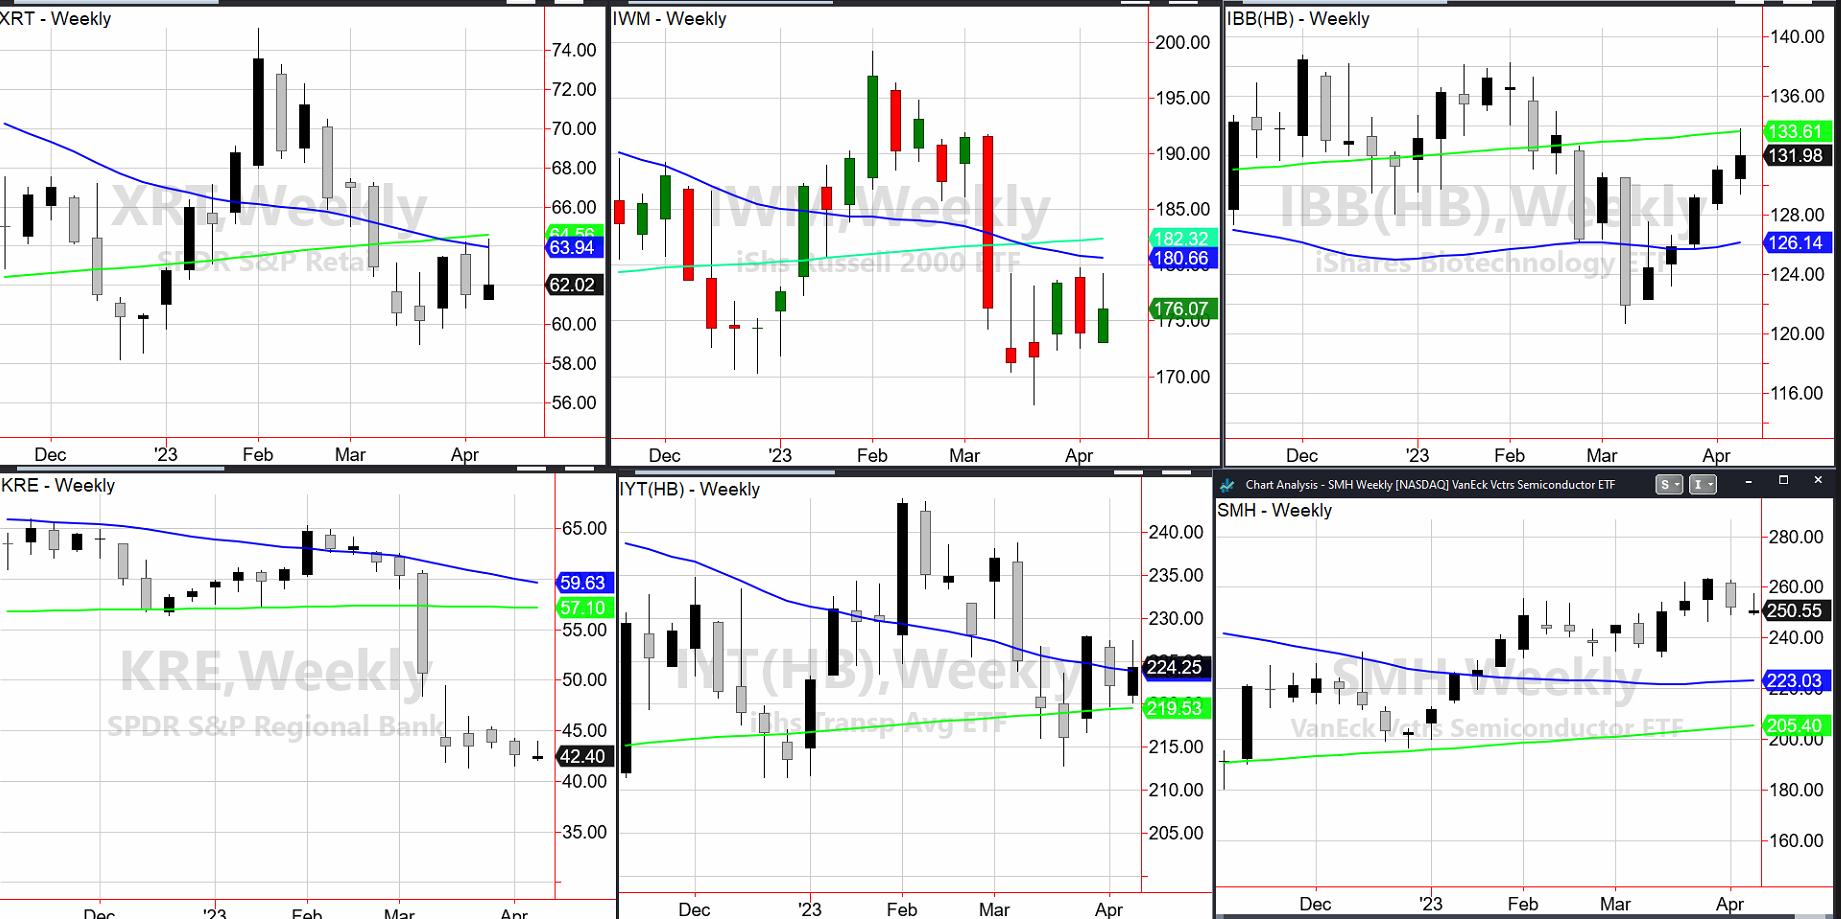
Meanwhile, here are the weekly charts of the Economic Modern Family. Bitcoin is our newest member, so let’s look at that too.
What do you see? Anything stand out as defining?
Each weekly chart has a 50-week moving average in blue. And a 200-week moving average in green. I have written a lot about the 23-month MA. I do also like the weekly MAs. They are widely looked at by institutional investors and give us a bit of a quicker time frame than a 2- or 6-year business cycle.
To begin with Granny Retail XRT, she ended the week near the lows of the week before and well above the March lows. Under 58, I’d get nervous about the consumer end. At this point though, all we did was test the price support pre-inflation and retail numbers. Defining? Nah–jury out.
Next is Granddad Russell 2000 (IWM). We can say the same about Gramps as we did about Granny. Is that why they are the Patriarch and Matriarch of the U.S. Economy?
Next is Big Brother Biotechnology (IBB). Not only did IBB close higher on the week, but he is right in the middle of the 2 moving averages. Defining? Nah–jury out.
Looking at our Prodigal Son Regional Banks (KRE), I even thought the bank earnings would give us some inkling of the next move. But no. Instead, KRE closed with an inverted doji candle, meaning anything can happen next as price takes a giant pause above last week’s lows.
Moving over to Transportation (IYT), that closed over the 50-week moving average and in a bullish phase. We like that. When demand picks up, we take note.
Sister Semiconductors (SMH), look strong. Like her grandparents, she is closing near the lows of this past week and the week prior. However, unlike her Granny and Gramps, she remains the leader of the Family and in a bull phase.
Finally, Bitcoin (BTC), defies all the talking heads. While Sister Semiconductors is our Wonder Woman, Bitcoin is our Rebel with a Cause. BTC closed the week at new yearly highs!
What we love about the Family is how their interrelationships, as well as their relationships to the overall macro, tell a story. The story right now goes back to last weekend’s commentary. A Picasso cubist painting: or a market with multiple perspectives that have distorted realities and perceptions. And most importantly, a really good time to know how to read charts.
For more detailed trading information about our blended models, tools and trader education courses, contact Rob Quinn, our Chief Strategy Consultant, to learn more.
IT’S NOT TOO LATE! Click here if you’d like a complimentary copy of Mish’s 2023 Market Outlook E-Book in your inbox.
“I grew my money tree and so can you!” – Mish Schneider
Get your copy of Plant Your Money Tree: A Guide to Growing Your Wealth and a special bonus here.
Follow Mish on Twitter @marketminute for stock picks and more. Follow Mish on Instagram (mishschneider) for daily morning videos. To see updated media clips, click here.
Mish in the Media
Mish joins David Keller on the Thursday, May 13 edition of StockCharts TV’s The Final Bar, where she shares her charts of high yield bonds, semiconductors, gold, and regional banks.
Mish shares her views on natural gas, crude oil and a selection of ETFs in this appearance on CMC Markets.
Mish talks what’s next for the economy on Yahoo! Finance.
Mish joins Bob Lang of Explosive Options for a special webinar on what traders can expect in 2023!
Rosanna Prestia of The RO Show chats with Mish about commodities, macro and markets.
Mish talks opportunites in the market in this appearance on Business First AM.
Mish and Charles Payne rip through lots of stock picks in this appearance on Fox Business’ Making Money with Charles Payne.
Mish talks Beyond Meat (BYND) in this appearance on Business First AM.
In this guest appearance on the Madam Trader podcast, recorded March 20, Mish shares her journey from special education teacher to commodoties trader and now trading educator. Hear her insights on the spring 2023 market conditions and how to harness the right skills to succeed.
Follow Mish as she breaks down current market conditions for her friends across the pond on CMC Markets.
Mish talks about Dominion Energy with Angela Miles in this appearance on Business First AM.
Coming Up:
April 13th: The Final Bar with David Keller on StockCharts TV and Twitter Spaces with Wolf Financial and Twitter Spaces with Mario Nawfal
April 19th: Closing Bell on Cheddar TV
April 20th: Benzinga Pre-Market Prep
April 24-26: Mish at The Money Show in Las Vegas
May 2-5: StockCharts TV Market Outlook
ETF Summary
S&P 500 (SPY): Tight range to watch this week — 412-415.Russell 2000 (IWM): 170 support, 180 resistance. Dow (DIA): Peeking over the 23-month MA, 336 — impressive if holds.Nasdaq (QQQ): 312 support, over 320 better.Regional Banks (KRE): 41.28 March 24 low held; now has to clear 44.Semiconductors (SMH): 258 resistance with support at 250.Transportation (IYT): 219-228 the wider range to watch.Biotechnology (IBB): 130 major pivotal area, 135 resistance.Retail (XRT): 58-64 trading range to break one way or another.
Mish Schneider
MarketGauge.com
Director of Trading Research and Education


