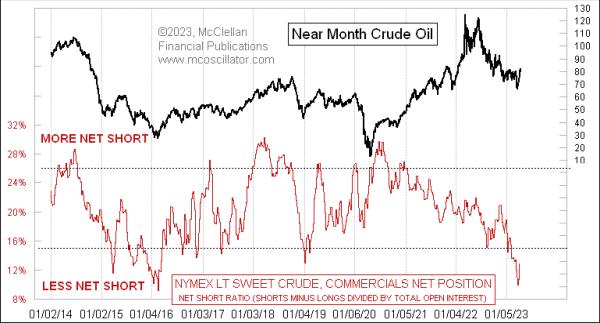
Crude oil prices were in the middle of an uptrend when Russia invaded Ukraine just over a year ago, and that news caused oil prices to spike up to over $120/barrel. But oil prices have given back those gains, getting cut almost in half since the last poke above $120 in June 2022. This has led the big-money “commercial” traders of crude oil futures to pare their short positions in a big way, as seen in this week’s chart.
Every Friday, the CFTC publishes its weekly Commitment of Traders (COT) Report, detailing how many futures contracts exist, and how many are owned by different groups of traders. The CFTC breaks these traders down into 3 groups. First, there’s commercial traders, who use the subject commodity in their trade or business — think of Cargill for wheat, as an example. Non-commercial traders are the large speculators, so think of hedge funds. And non-reportable traders are the small speculators, ones whose positions are so small that the CFTC figures it is not worth bothering tracking their holdings individually.
The net positions of these 3 different categories can be more or less significant in the different futures markets, so it can pay to look at the net position of each category. Usually, the commercial traders are the “smart money”, since traders who are in that business tend to know a lot about it, and know what a proper price is. For crude oil futures, a lot of the commercial traders are oil producers who are using the futures market for its intended purpose, so that they can lock in pricing today for oil that they are going to produce and deliver months from now. When an oil producer enters into a futures contract to sell his future production now, that is a short position, and some other trader takes the long side. That other trader may be a refiner, for example, or a speculator.
Because oil producers use the futures markets for this purpose, the commercial traders of crude oil futures are nearly always net short to varying degrees. The last time they were actually net long as a group was in 2009. Thus, the game for analysts is to evaluate the message of the commercial traders’ current position relative to past levels.
Two weeks ago, the commercial traders were at their lowest net short position as a group since 2016. They were saying then that the current prices are so low that these traders do not want to lock in these prices. They would rather let prices float and hope to do better months from now.
OPEC+ also apparently believes that current prices are too low, and so, on April 2, that organization announced a cutback in production, which caused an immediate $5 jump in oil prices. The commercial traders were right about prices being too low. Since that action by OPEC+, the commercial traders have raised their net short position just slightly, matching the price action. But they are still net short as a group in a very minimal way, indicating that there is a lot more room for oil prices to rise before this indicator would say that prices have risen too far.
Every Friday, I review the new developments in the COT Report data for selected futures contracts, and provide updates on some of them in my Daily Edition.


