


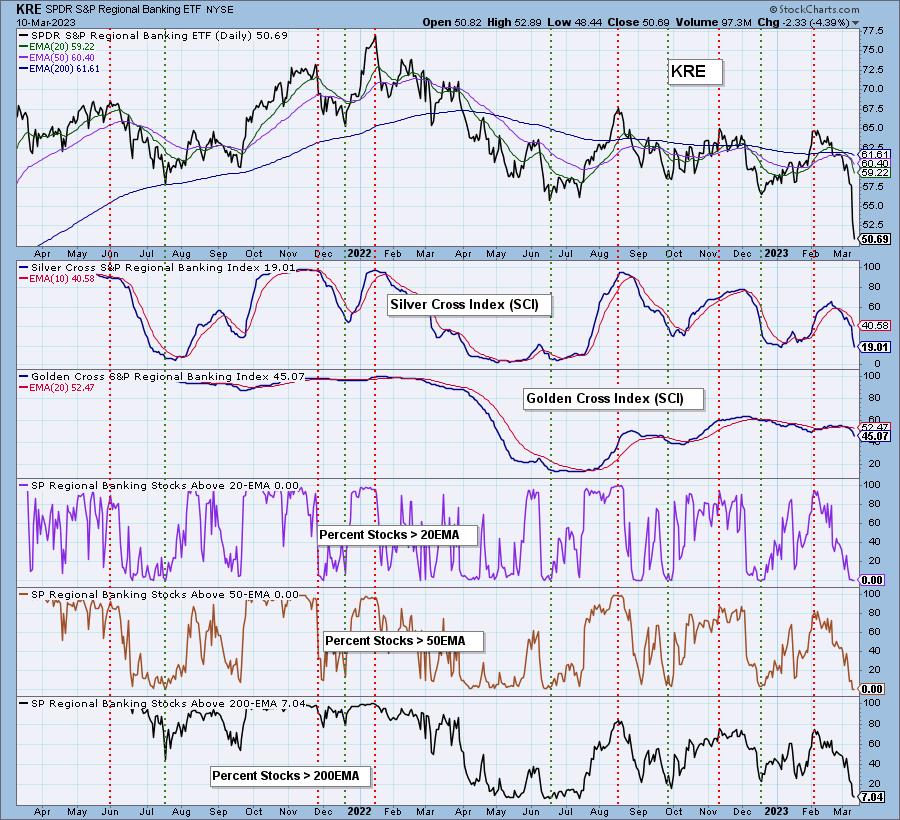
While the Banking Sector (KRE) collapsed this week due to the Silvergate and Silicon Valley Bank failures, we can see where participation has been deteriorating for more than a month. The bottom three panels on the chart below shows how the Percent of Stocks Above the 20/50/200EMAs began to drop rapidly from the beginning of February, and they are now reading 0%, 0%, and 7%.
When price is below an EMA, it pulls it down, and eventually the faster EMA crosses down through the slower EMA. Our Golden Cross and Silver Cross Indexes keep track of these events and display the percent of stocks in an index with the 50EMA above the 200EMA (Golden Cross), and the percent of stocks with the 20EMA above the 50EMA (Silver Cross). Currently the Silver Cross Index (SCI) reads 19%, and the Golden Cross Index (GCI) reads 45%; however, they are doomed to head much lower because Percent of Stocks Above the 20/50/200EMAs are in the basement.
The broader Financial Sector (XLF) is also being impacted by the banks, and the Percent of Stocks Above the 20/50/200EMAs for XLF have tanked and are bound to drag the SCI and GCI lower. Naturally, price will be headed lower as well.
Conclusion: Could the decline of the Banking and Financial Sectors be the beginning of an avalanche that will take out the market? In my opinion, it is not something we should dismiss entirely. There are bubbles in equities, real estate, bonds, pension funds, debt, and crypto. A banking collapse is a good place to kick off a wider disaster. To be clear, I do not claim to know what is going to happen, but it is certainly a good time to be more alert.
Watch the latest episode of DecisionPoint on StockCharts TV’s YouTube channel here!
Technical Analysis is a windsock, not a crystal ball. –Carl Swenlin
(c) Copyright 2023 DecisionPoint.com
Helpful DecisionPoint Links:
DecisionPoint Alert Chart List
DecisionPoint Golden Cross/Silver Cross Index Chart List
DecisionPoint Sector Chart List
Price Momentum Oscillator (PMO)
Swenlin Trading Oscillators (STO-B and STO-V)
DecisionPoint is not a registered investment advisor. Investment and trading decisions are solely your responsibility. DecisionPoint newsletters, blogs or website materials should NOT be interpreted as a recommendation or solicitation to buy or sell any security or to take any specific action.


