


Stocks and ETFs trading at or near new highs are leading with clear uptrends. These are the names we want on our watchlist or in our portfolio. We can find leaders by checking the list of 52-week highs or by using the StochClose indicator, which is part of the TIP Indicator Edge Plugin. Today’s article will show how StochClose works and provide a list of current leaders.
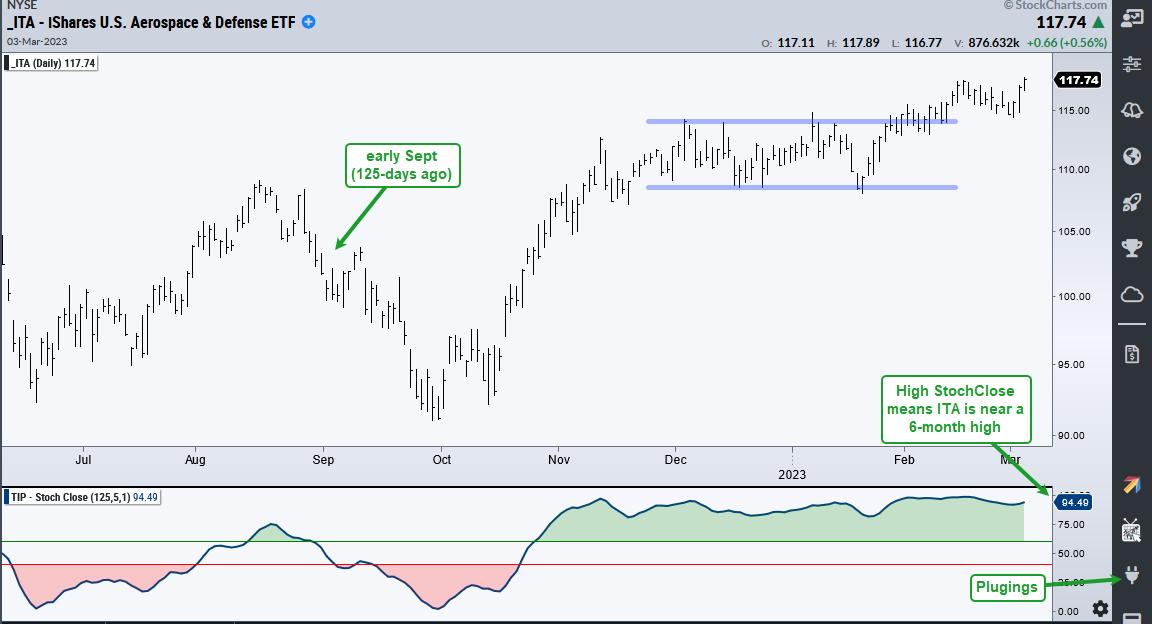
The chart below shows the Aerospace & Defense ETF (ITA) hitting a new high last week and the StochClose indicator captures this price strength. StochClose is the Stochastic Oscillator based on closing prices. StochClose (125,5) covers 125 days and this period extends back to early September. Six months is my personal sweet spot for price ranking. StochClose measures the level of the current close relative to the closing high-low range over the last 125 days. Values above 90 mean price is near a six month high, while values below 10 mean price is near a six month low. Note that raw values are smoothed with a 5 day SMA, which introduces a little lag.
The bottom window shows StochClose (125,5) moving above 60 and turning green in late October. Values above 60 indicate that price is in the upper half of its six month range (cup is half full). StochClose is currently at 94.49 and this means price is near a six month high. The raw value would be higher because there is a 5-day smoothing, but I prefer a short smoothing periods because it reduces whipsaws.
The image below shows the ETF TrendComp StochClose Rank Table from TrendInvestorPro. This table shows Trend Composite signals and the StochClose rank for 275 ETFs in our Master List. ITA is number seven on the list, right below the Oil & Gas Equipment & Services ETF (XES). The “Allw” in column two refers to the 50 ETFs that are part of the All Weather List. TrendInvestorPro runs a quantified strategy trading these 50 ETFs using Trend Composite signals and StochClose ranking.
TrendInvestorPro is currently working with three quantified strategies for trading ETFs. In addition to the All Weather Strategy, we have a Trend-Momentum Strategy for 74 stock-based ETFs and a Mean-Reversion Strategy for a broad list of 138 ETFs. Each strategy comes with a detailed article and quantified results. We also update signal tables on a daily basis. Click here to learn more.
StochClose, the Trend Composite, ATR Trailing Stop and eight other indicators are part of the TrendInvestorPro Indicator Edge Plugin for StockCharts ACP. Click here to learn more and take your analysis process to the next level.
—————————————


