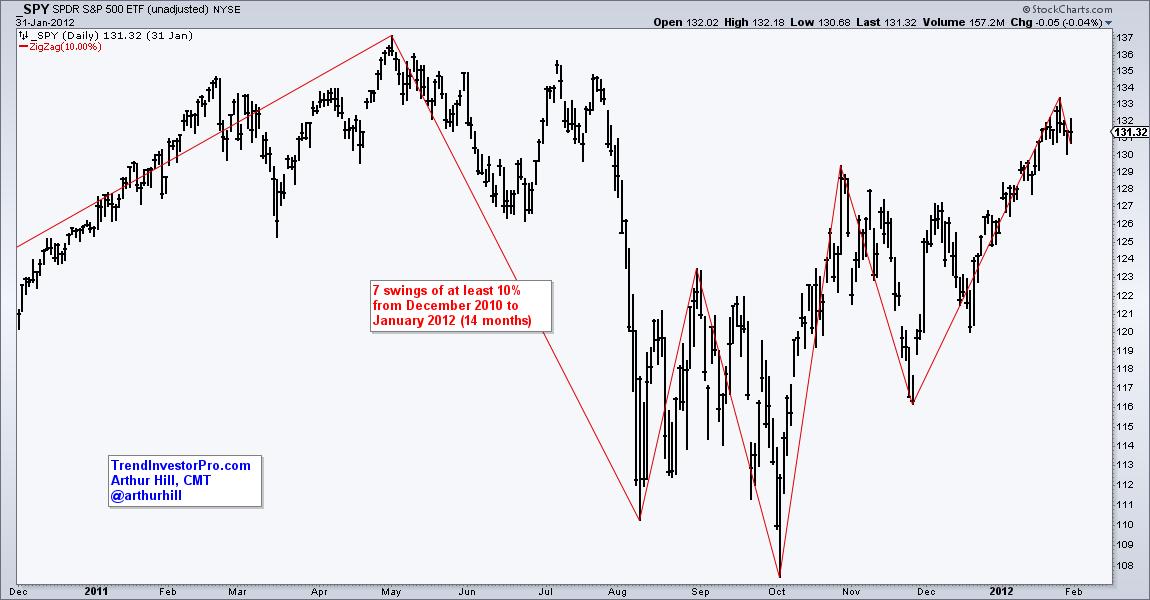
The S&P 500 SPDR (SPY) is a period of big swings and above average volatility. There were six swings of at least 10% from late January to early February 2023. Looking at other 12-14 month periods, this is the fourth most in the last 23 years. There were 13 in 2008, 8 in 2000 and 6 in 2011. 2008 marked the Global Financial Crisis, while 2000-2001 marked a bear market. 2011 was a chaotic period when the European Sovereign Debt crisis rocked the markets. Note that I am not using exact calendar years. I added a month or two of padding to show the general idea.
The chart below shows the swings from January 2022 to February 2023. Most recently, there was a 10% upswing from mid October to mid December and then an 8.8% downswing. This decline does not count as a 10% swing so the Zigzag did not draw a line down. This means the October to February swing is one big “zag” higher.
So what does this mean? It means that volatility is above average, which increases the chances of a reversal and another big swing. SPY broke above its December high and has an uptrend working since October (higher low and higher high). Volatility remains a concern going forward and a short-term reversal at this point could lead to another sizable downswing. Friday’s report at TrendInvestor set the key levels to watch and two indicators for long-term signals. Short-term, SPY a falling flag is taking shape and a breakout at 415 would be bullish.
TrendInvestorPro is currently working with three quantified strategies for trading ETFs. We have a Bull-Bear Strategy trading the All Weather List, a Trend-Momentum Strategy Trading stock-related ETFs and a Mean-Reversion Strategy. Each strategy has a detailed article and signal tables are updated daily. Click here to learn more.
The Trend Composite, Momentum Composite, ATR Trailing Stop and eight other indicators are part of the TrendInvestorPro Indicator Edge Plugin for StockCharts ACP. Click here to learn more and take your analysis process to the next level.
—————————————


