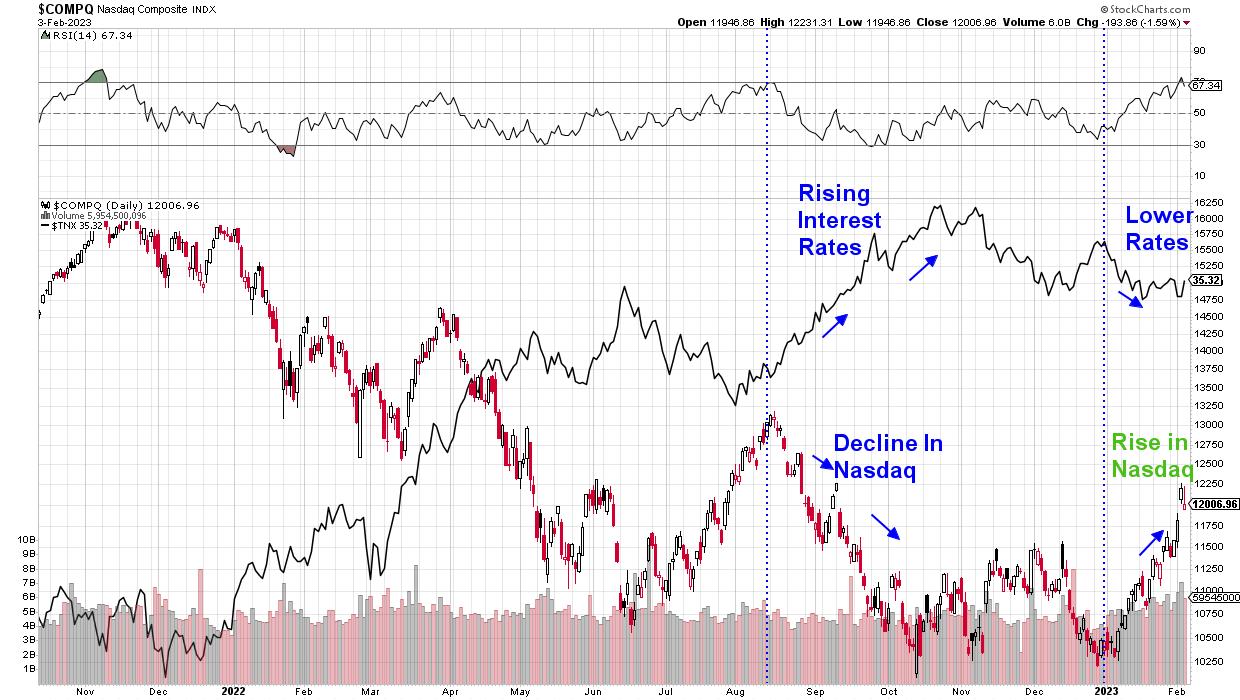
The Nasdaq just booked its 5th consecutive weekly gain which is the longest winning streak in over a year. The rally has occurred amid strong earnings reports from some major tech companies. Also driving this Index higher is bottom fishing among investors looking for quality Software and Retail stocks that were crushed during a period of rising interest rates last year. Rising interest rates are a negative for Growth stocks as they lower the value of future earnings.
DAILY CHART OF NASDAQ ($COMPQ) VS YIELD ON THE 10-YEAR TREASURY ($TNX)
Subscribers to my MEM Edge Report were alerted to a bullish turnaround in the Nasdaq after this Index posted a follow-through day in early January. This unique occurrence signaled a near-term bottom in the markets and recent price action has further strengthened our conviction that the markets are headed higher from here.
One of many reasons for my positive bias for the markets is last week’s sharp gain in Meta Platforms (META) which took place after the company announced better than expected results while also speaking positively about their growth prospects for 2023. The stock gapped up 23% on the news as well the announcement of a huge share buyback program.
Gaps up in the price of mega-cap Growth stocks is not very common and the huge volume that accompanied last week’s rally points to a stock that’s under accumulation. In fact, the last time META posted this sharp of a gain on heavy volume was in July of 2013 after the company posted much better than expected mobil ad sales numbers. Below is a chart of the company at that time and as you can see, the gap up into a base breakout marked the beginning of a 59% gain before Facebook formed a secondary base.
DAILY CHART OF META PLATFORMS (META) IN 2012-2013
While market conditions in July of 2013 were much different from now, the fact remains that gaps up in price into a base breakout are one of the most powerful base formations as they often lead to greater gains.
As you can see in the chart above, META’s RSI remained in an overbought position for several months in 2013 before pulling back. Also of note is the continued high volume which took place after the initial gap up in price. This is critical price action in the beginning stage of the stock’s advance as it points to high demand which can sustain a more prolonged advance. Next week’s price action in META will help determine its ability to climb higher from here.
DAILY CHART OF META PLATFORMS, INC. (META) INTO FRIDAY’S CLOSE
Going forward, another signal that the current uptrend in META still in place will be a bullish position of both the RSI and MACD going forward. This would mean that they remain above 50 for the RSI and above zero for the MACD. Most important will be a bullish backdrop for the broader markets which are currently in an uptrend as market conditions will drive investor sentiment regarding underlying stocks.
If you’d like to be kept up to the minute on market conditions as well as have access to the winning Growth stocks on my Suggested Holdings List, use this link to receive immediate access to my twice weekly MEM Edge Report. Last week, a key sector entered a downtrend which we highlighted in yesterday’s Thursday Alert report and you can uncover this as well.
It’s an exciting time to be investing given the strength in the current market uptrend. Use the link above so you can confidently take advantage of the bullish shift in the markets!
Warmly,
Mary Ellen McGonagle – MEM Investment Research (powered by Simpler Trading)


