Connect with us

Hi, what are you looking for?

Stocks

You Gotta Love a Good Wedgie

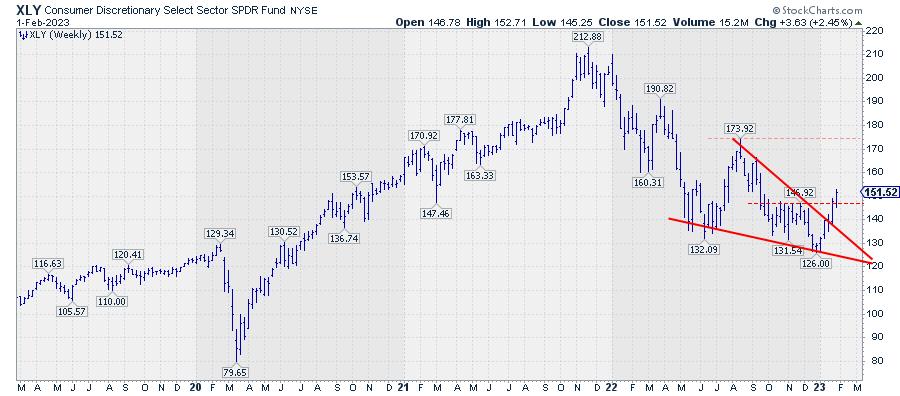
In the second half of 2022, the price chart for XLY started to form a falling wedge pattern.

This pattern or formation is characterized by two converging trendlines, BOTH moving lower. The falling wedge variant comes in two variations. It can be either a continuation within an established uptrend or a reversal pattern at the end of a downtrend. Either way, the falling wedge is considered to be a bullish formation.

You can read more on falling wedges in this ChartSchool article.

In the case of XLY, the wedge started forming in mid-year 2022 when the price bottomed around 132 twice before jumping back to 174. The leg down from that high found support at slightly lower levels than before, then rallied again to 147 before dropping to its recent low at 126.

The support and resistance lines connecting these highs and lows mark the upper and lower boundaries of the wedge. Last week XLY managed to break out of that wedge to the upside, and it is getting a good follow-up so far this week, with XLY taking out the previous high(s) at 147.

Based on the theoretical target price XLY now has more upside potential to levels around 174, which is the highest point in the formation.

#StayAlert, –Julius

    You May Also Like

    Politics

    When George Santos mentioned his family during his congressional campaign, the New York Republican often reflected on the work ethic and strength of his...

    Sports

    Kicker Alejandro Mata is following former Tigers coach Deion Sanders to Colorado. ‘Thankful to be committed and signed to the University of Colorado,’ Marta wrote on...

    Business

    Two of Sam Bankman-Fried’s top business partners — a co-founder of the cryptocurrency exchange FTX and the former CEO of the hedge fund Alameda...

    Stocks

    SPX Monitoring Purposes: Sold long SPX 1/27/23 at 4070.56 = Gain 6.51%; Long on 12/20/22 at 3821.62. The top window is the cumulative GDX...

    Disclaimer: SecretCharts.com, its managers, its employees, and assigns (collectively “The Company”) do not make any guarantee or warranty about what is advertised above. Information provided by this website is for research purposes only and should not be considered as personalized financial advice. The Company is not affiliated with, nor does it receive compensation from, any specific security. The Company is not registered or licensed by any governing body in any jurisdiction to give investing advice or provide investment recommendation. Any investments recommended here should be taken into consideration only after consulting with your investment advisor and after reviewing the prospectus or financial statements of the company.

    Copyright © 2024 SecretCharts.com | All Rights Reserved