The ghost of the Hindenburg Report continues to haunt the Indian stock markets; the markets have witnessed a sharp selloff over the past two sessions after the activist short-seller leveled some serious allegations against the Adani Group. While Hindenburg Research specializes in “forensic financial research”, they have accused the Adani Group of serious financial wrongdoings, massive stock price manipulation, and running an accounting fraud scheme for decades.
Over and above this, the markets will also face the Union Budget 2023 which is scheduled to be tabled on Wednesday, February 01. The volatility is expected to rule the roost and we will see the markets in general going all over the places and stay highly volatile through the coming week.
Amid this uncertain and volatile environment, some components from the broader markets are showing resilience and some signs of a potential bottom in place, and some possibility of a technical pullback. Such setups would work even better with low beta stocks that are overall less volatile. Such as this retail stock that is seen laying the ground for a potential technical pullback from the current levels.
Trent Ltd (TRENT.IN)
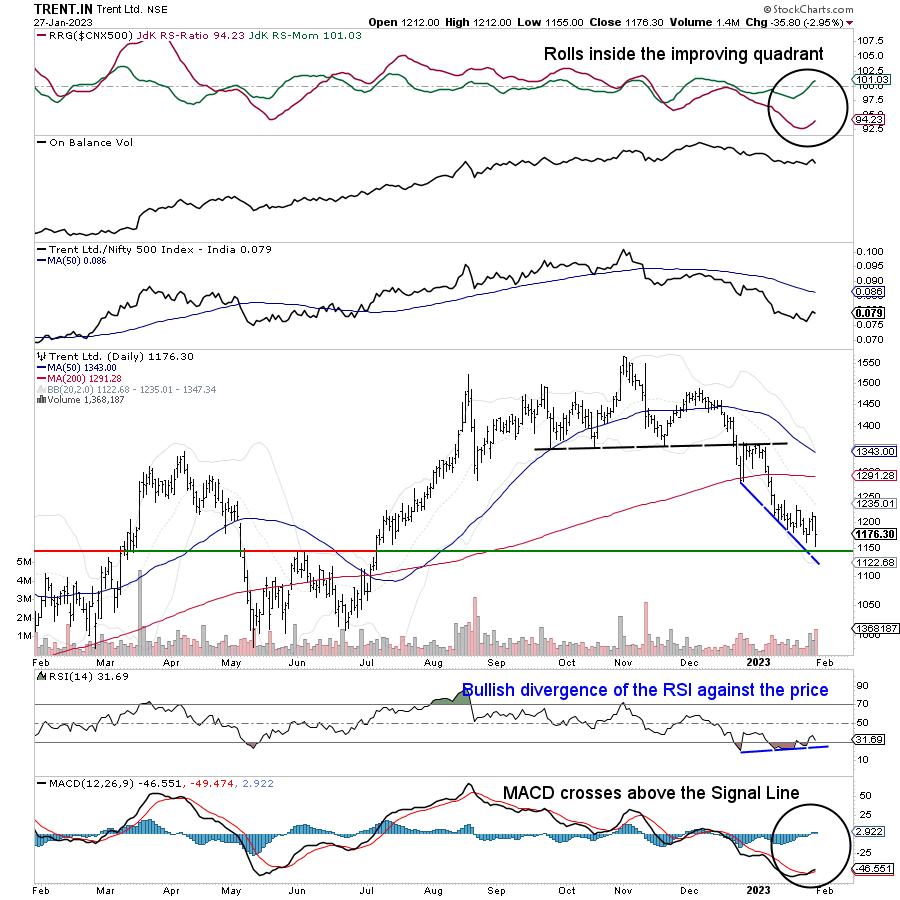
TRENT.IN marked its high near 1500 levels in August last year; after a brief consolidation, the stock attempted to take out that level in November. However, after marking an incremental high near 1550, the attempted breakout failed. The stock not only came off from the highs below the breakout point, but it also slipped further into corrective decline. The subsequent price action post the failed attempt to break out also resulted in the formation of a complex Head & Shoulders pattern. Subsequently, the stock declined and while completing its price measurement downside target, it tested the zone of 1150-1160 recently. Overall, the stock has relatively underperformed the broader markets over the past months.
The most recent price action has shown an emergence of a strong bullish divergence of the RSI against the price. While the price marked lower bottoms, the RSI did not; this led to the formation of a bullish divergence against the price. Besides this, RSI also shows a classical bullish failure swing. RSI slipped below 30, it bounced back but retraced again. However, it did not mark a new low and bounced back above the previous high point resulting in a bullish failure swing.
MACD has shown a positive crossover; it is now bullish and trades above the signal line. The stock has also rolled inside the improving quadrant; this hints at a likely beginning of the phase of relative outperformance of the stock over the coming days. The stock has rolled inside the improving quadrant of the Relative Rotation Graph (RRG). This hints at a potential beginning of phase of relative outperformance of the stock against the benchmark which in this case is the broader NIFTY500 index.
If the stock stages a technical pullback, it has the potential to 1290 levels. This would translate into a potential price appreciation of 8% to 10% from the current levels. Any close 1110 would negate this view.
and
Milan Vaishnav, CMT, MSTA | Consulting Technical Analyst | www.EquityResearch.asia | www.ChartWizard.ae


