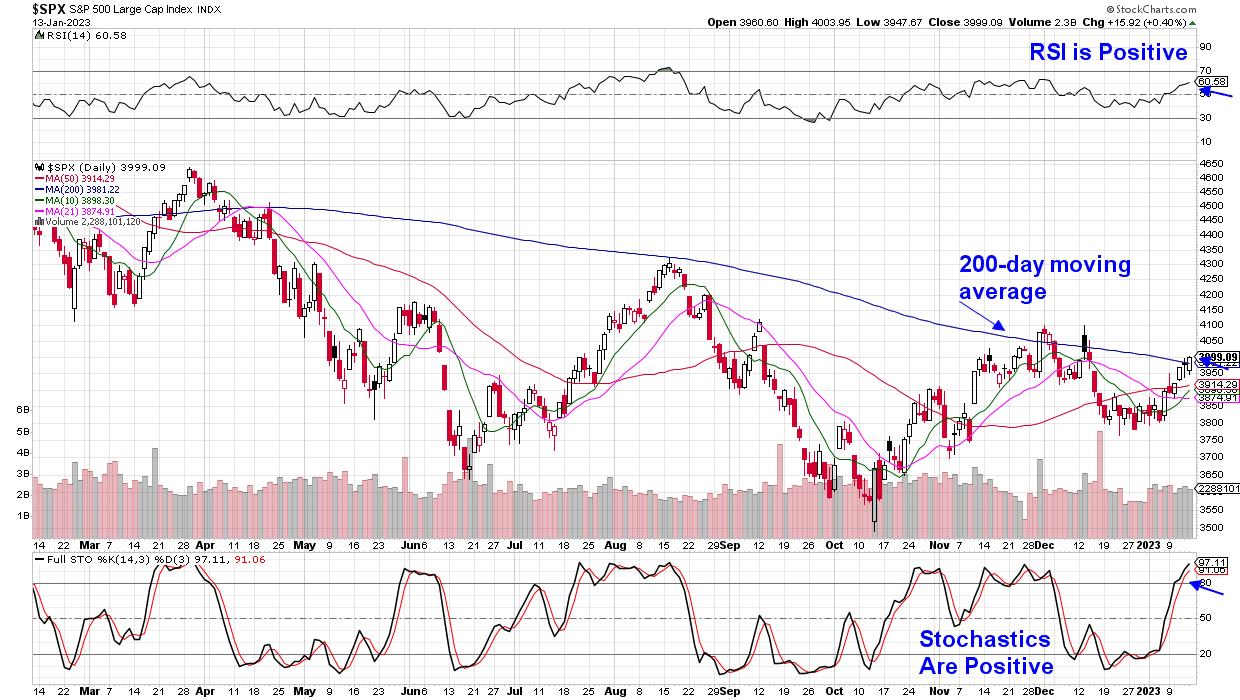
It was a solid week for the markets, with the S&P 500 advancing above its key 200-day moving average, a major area of possible upside resistance. With a positive RSI and Stochastics, the markets are poised to advance further as we enter an earnings season that’s been marked by results being rewarded, despite not being particularly strong.
DAILY CHART OF S&P 500 INDEX
The Consumer Discretionary sector was the top performer, helped by a double-digit rally in retailer Amazon (AMZN), which remains 43% below its 52-week high despite the sharp gain. The stock was upgraded after news that every company can participate in the once-exclusive free, 2-day Prime delivery program.
Other Retail stocks also rallied, as hints of lower inflation, coupled with a Consumer Confidence report that put the number at a 10-month high, pushed the S&P Retail ETF (XRT) into positive territory. The longer-term weekly chart shows the RSI now in positive territory, with the MACD poised to turn positive as well.
WEEKLY CHART OF S&P RETAIL ETF (XRT)
One standout area has been Specialty Retailers that manufacture or sell comfortable footwear. This would include companies such as Crocs Inc. (CROX), which manufactures shoes made with a proprietary plastic material and was one of 2022’s fastest growing brands.
Subscribers to my MEM Edge Report were alerted to the stock in early December, after it was added to our Suggested Holdings List. Since then, CROX has gained over 20% as analysts continue to raise estimates. Despite healthy gains, the stock trades at only 12 times trailing 4 quarter earnings, which is well below its peers.
DAILY CHART OF CROCS, INC. (CROX)
The running category has been another success story among the footwear industry, as a staggering number of people headed outdoors as gyms closed amid the pandemic. Companies such as Deckers Outdoor (DECK) saw their Hoka brand of sneakers hit the one-billion mark over the past 12 months, in a move that rivals sales in Deckers’ already popular Ugg footwear.
DAILY CHART OF DECKERS OUTDOOR CORP. (DECK)
Well-known footwear company Nike (NKE) is also in a confirmed uptrend, after gapping up in price on the heels of crushing earnings estimates in late December. Management guided growth estimates higher going forward as well, amid increased digital sales and inventory control measures. NKE is approaching an overbought condition at this time.
While each of these Retailers are poised for further upside over time, newer areas within the markets have just begun their ascent, as a rotation int0 Basic Materials and areas of Industrials is pushing select stocks into the beginning stages of an uptrend. If you’d like access to those stocks, use this link here to access a 4-week trial of my twice weekly MEM Edge Report for a nominal fee. You’ll also be alerted to signals that the current bear market rally is reversing so that you can preserve capital ahead of the true market bottom.
Be sure and take advantage of this special offer ahead of next week’s critical economic data and other possible headwinds.
Warmly,
Mary Ellen McGonagle, MEM Investment Research


