


I have been quiet on the video and blog side of things over the past weeks. Still, just before you pop the champagne for a grand New Year’s eve celebration, I want to take the opportunity to look back at maybe the most important or dominant rotation that took place in 2022.
I am talking about the Growth vs. Value rotation.
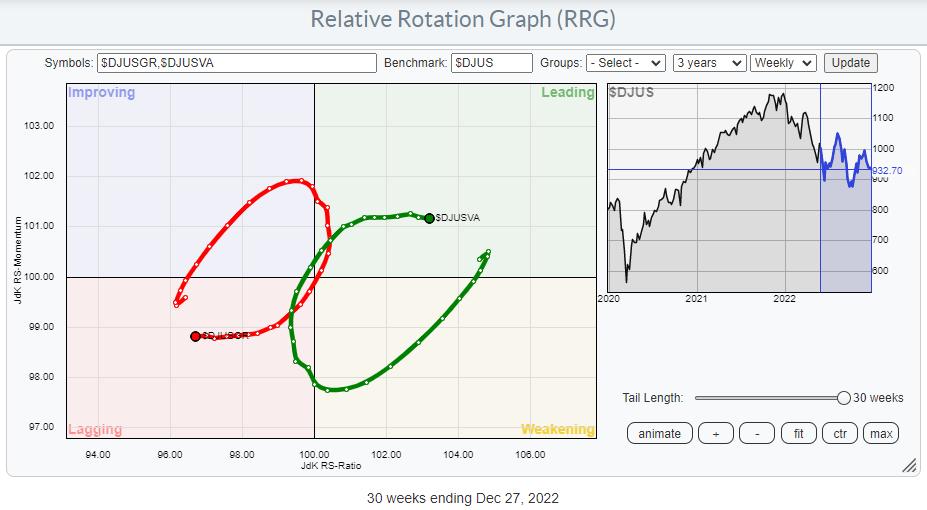
The RRG above shows the last 30 weeks of that rotation, but the story starts at the beginning of the year and the first six months of 2022.
The RRG above captures that rotation. The starting point of the tail is at the start of the year, and the tail ends on August 8. So the year started with Growth entering the lagging quadrant while Value moved into leading. The dominance of Value over Growth lasted until mid-March when both tails began to bend. Value started to lose relative momentum and rolled over inside the leading quadrant while Growth moved opposite inside lagging.
The loss / gain of momentum pushed Value into lagging and Growth into leading at the end of August, but even during this “counter move,” value stocks maintained their outperformance vs. Growth.
The tails started to bend in the week of March 7 and entered the opposite quadrant in the week of August 29. During that period, Value lost 6% while Growth lost 8.2%.
As you can see on the RRG at the top of this article, the tails started to move in opposite relative momentum directions almost immediately after entering the leading/lagging quadrant at the end of August, re-entering the downtrend of Growth vs. Value.
Over the last weeks, the relative momentum (RS-Momentum) has leveled off, but the increase in relative strength is still there, and that is how this relationship will be entering 2023.
A Massive Double Top
The regular price-time chart shows how bad this 1-1 relationship developed through 2022.
After many years of Growth dominance, this relationship formed a massive double-top formation, confirmed when the ratio dropped below the 2021 bottom near 1.3750. Based on that big reversal pattern, a price target can be calculated either around 1.14 when using a percentage-based move or around 1.10 when using the absolute difference. Either way, we are not there yet.
And even when this ratio would find support somewhere in the 1.10-1.14 range in the first weeks of 2023, it seems very unlikely that it will revert and immediately start a steep uptrend again. Plenty resistance levels are waiting to the upside, which will cap any rally for the time being.
If any value can be taken from this ratio as a risk on / risk off metric the message is pretty clear; we are still in risk off mode for now.
Based on these observations, my take on the markets at the start of the new year will still be very cautious. We may see some pockets of improvement here and there or maybe in the market as a whole ($SPX), but risk remains elevated at the moment.
I wish all a very happy and healthy new year, and I hope to see you as readers of the RRG blog and/or watchers of Sector Spotlight in 2023.
#StaySafe –Julius


