


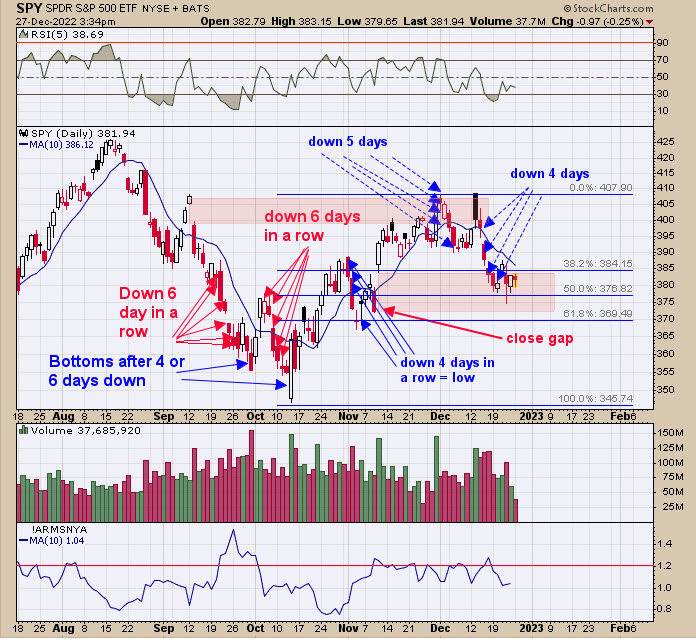
Last week, trading was below last week’s low on lighter volume, but then closed above last week’s low. It’s said, “If a market can’t take out the previous low on higher volume, it will reverse and attempt to take out the previous high.” In the current situation, this would give a target for the week of December 16 high near 410 on the SPY. If the December 16th week high is tested on higher volume, then it would move the target to the next higher high, which is the August high near 430. Also notice that the SPY found support near the 50% retracement level from the rally up from early October. This condition suggests the 410 SPY level may be exceeded, which opens the door to the 430 SPY level, which is the August high.
When the SPY is down four to six days in a row, the market can make a lower low before it reverses back up (noted on chart). SPY has been hovering around the November 10 gap since December 19. The November 10 gap has been tested on lighter volume, which suggests the gap has support. The weekly chart of SPY (see above) leans bullish, in that last week’s tests of the week before lows were on lighter volume, suggesting support and giving a target back to the 410 SPY range. Hold long the SPX for now.
Last Thursday, we said that both of the weekly 18-day averages of the Up Down volume and Advance/Decline indicators’ Bollinger Bands® are pinching, suggesting a large move is nearing. The blue and red arrows mark previous times when the Bollinger Bands pinched on these indicators, which happened right before large runs in GDX. The bottom window is the Bollinger Bandwidth; when it’s low the Bollinger Bands are at a narrow range and, when high, the bands are wide apart. When the Bollinger Bandwidth is low and turns up, that is when large moves can happen. The Bollinger Bands have been narrow for several months and are now starting to turn up on these indicators. These indicators are rising, suggesting the move will be up. If the indicators rally, so will GDX.
Tim Ord,
Editor
www.ord-oracle.com. Book release “The Secret Science of Price and Volume” by Timothy Ord, buy at www.Amazon.com.
Signals are provided as general information only and are not investment recommendations. You are responsible for your own investment decisions. Past performance does not guarantee future performance. Opinions are based on historical research and data believed reliable; there is no guarantee results will be profitable. Not responsible for errors or omissions. I may invest in the vehicles mentioned above.


