Reminder: Prices go up for DecisionPoint.com subscriptions in January. Details are below the article.
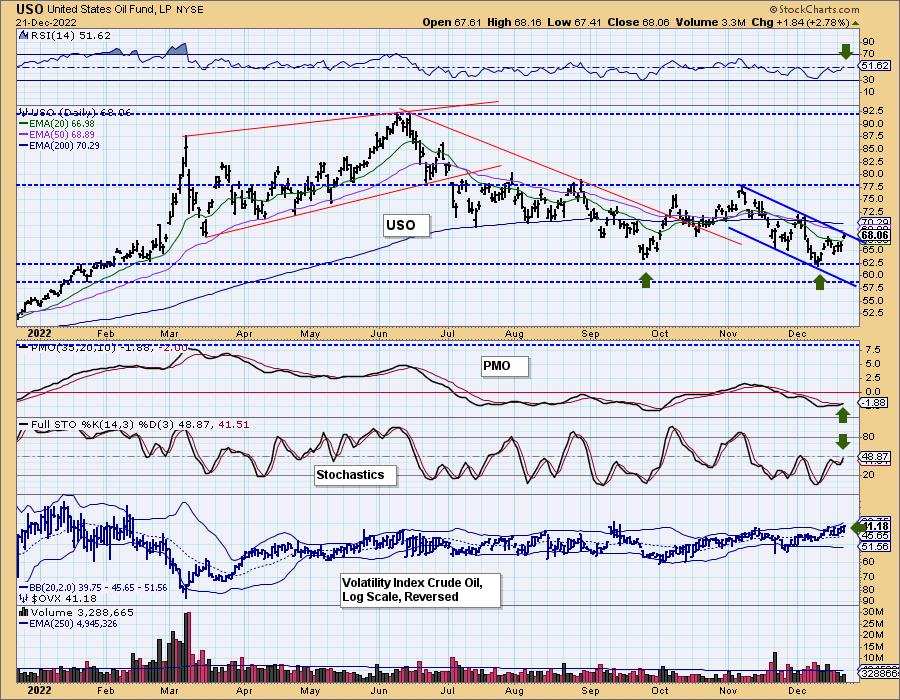
Crude oil has been in a short-term declining trend since the beginning of November. Big picture: it is in a large trading range. After spending so much time being beaten down, it’s finally making the turn. This looks more promising than the last rally as the PMO didn’t confirm it.
Price hasn’t managed to pull out of its declining trend channel, but today’s big gap-up move suggests that it might. The indicators also favor a breakout. The relative strength index (RSI) just moved into positive territory and the PMO triggered a crossover buy signal today. The stochastic oscillator is also confirming, as it rises again toward positive territory above net neutral (50).
We also follow the Cboe Volatility Index for crude oil ($OVX). As with the Cboe Volatility Index ($VIX) on its inverted scale, we look at where it is in relation to its moving average to determine internal strength and weakness. Currently, it’s oscillating above its moving average which implies internal strength. We also would like to point out that we could be looking at an intermediate-term double-bottom forming.
The iShares 20+ Year Treasury Bond ETF (TLT) also saw a new PMO crossover, but to the downside. This PMO sell signal looks dangerous as it’s coming in very overbought territory. The correction in interest rates is over, in our view, so we expect TLT to return to the strong support zone at the November lows. Price managed to close above the 50-day exponential moving average (EMA), but it’s barely hanging on. The RSI moved into negative territory and stochastics are dropping vertically. This appears to be the end of the rally in TLT as the 20-year yield recovers.
Watch the latest episode of DecisionPoint on StockCharts TV’s YouTube channel here!
Our prices are going up in January!
If you’ve thought about getting a DecisionPoint subscription, now is the time to subscribe! Our prices will be going up! Our Bundle currently is $68/month. In January it goes up to $119/month. The DP Alert will go from $35/mo to $50/month. DecisionPoint Diamonds will go from $40/month to $80/month. Don’t delay! Once you subscribe, you get to keep your low rate even when we raise prices! **
** In order to keep your low rate, your subscription must continue running and remain in good standing.
Technical Analysis is a windsock, not a crystal ball. –Carl Swenlin
(c) Copyright 2022 DecisionPoint.com
Helpful DecisionPoint Links:
DecisionPoint Alert Chart List
DecisionPoint Golden Cross/Silver Cross Index Chart List
DecisionPoint Sector Chart List
Price Momentum Oscillator (PMO)
Swenlin Trading Oscillators (STO-B and STO-V)
DecisionPoint is not a registered investment advisor. Investment and trading decisions are solely your responsibility. DecisionPoint newsletters, blogs or website materials should NOT be interpreted as a recommendation or solicitation to buy or sell any security or to take any specific action.


