


The oil sector has pulled back roughly 20% over the last 4 weeks. It’s been an aggressive move down, and I was interested to hear that Mark Fisher thinks the bottom is in for oil. MBF trading is a big deal. He is a brilliant man, so I definitely want to check my work.
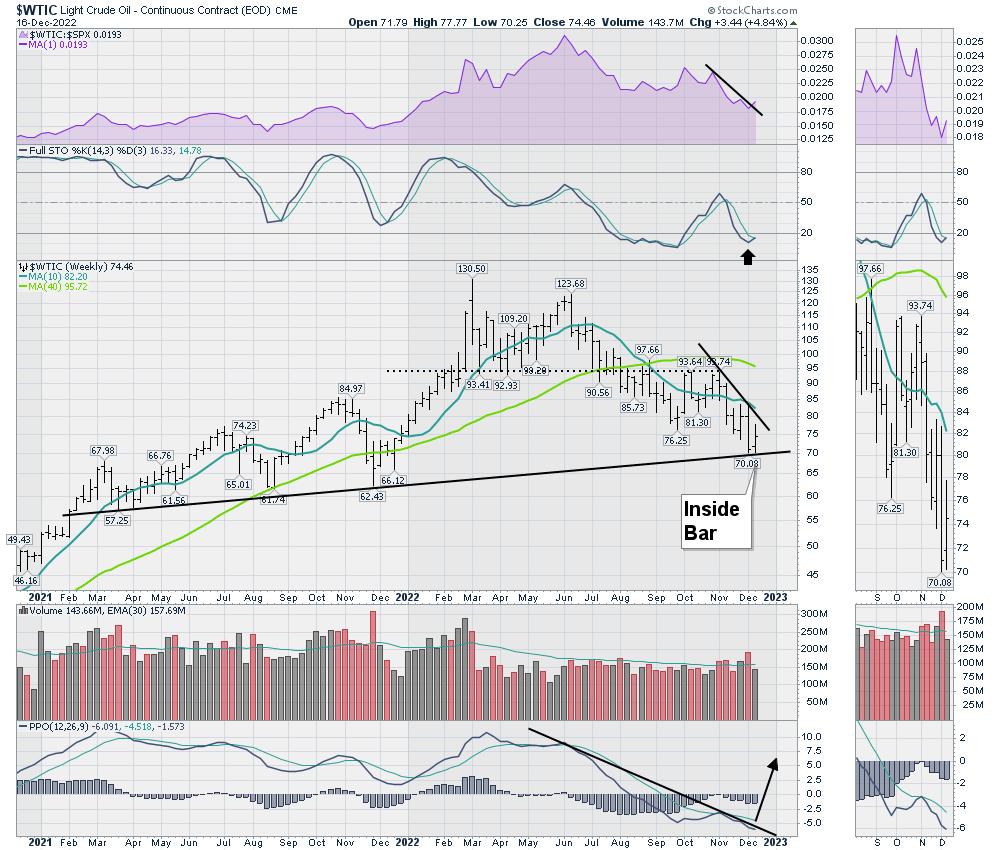
When I see the crude oil chart, it is on what, for me, is a sell signal. But the price action this week was pretty strong compared to the rest of the market. The relative strength downtrend in purple did try to tick up this week. The Full Sto is turning up onto a buy signal.
Price is making an inside bar, which I like to think of as indecision. If we can start to make higher highs here, that would be a textbook bounce off the uptrend. The PPO is at one of the most interesting points where I like to buy. When it breaks above this long 6-month PPO downtrend, I would rather be long.
$CRB
When I look at the $CRB chart, it is broken. But if it was to reverse higher here, it would be a false break down. When a breakdown reverses, that is very bullish.
I like to buy commodities near the lows. If these charts can improve, that would be bullish. The stock market last year dropped through the first quarter, but the oil markets kept rallying. The real question is, if that same market action is to be endured, whether oil can rally in the face of the slow economy.
XOP
The Oil Exploration and Production ETF is hanging on the trend line. Right now, everything on the chart is pointed down. The fast move from $160 to $130 could be a normal pullback in an uptrend, but, if the price does not hold this trend, it can move down extremely fast. Last December, the indicators were in a similar position, and they all started to turn up from there on a nice rally.
With the overall stock market failing, it really is a tough call. But, for investors that like to buy at the trend line with a close stop, this looks like a nice location. I think the close stop is critical. If this chart continued to make lower lows, I would not be looking at it. It is the indecision at the trend line that suggests this might be ready to turn higher.


