


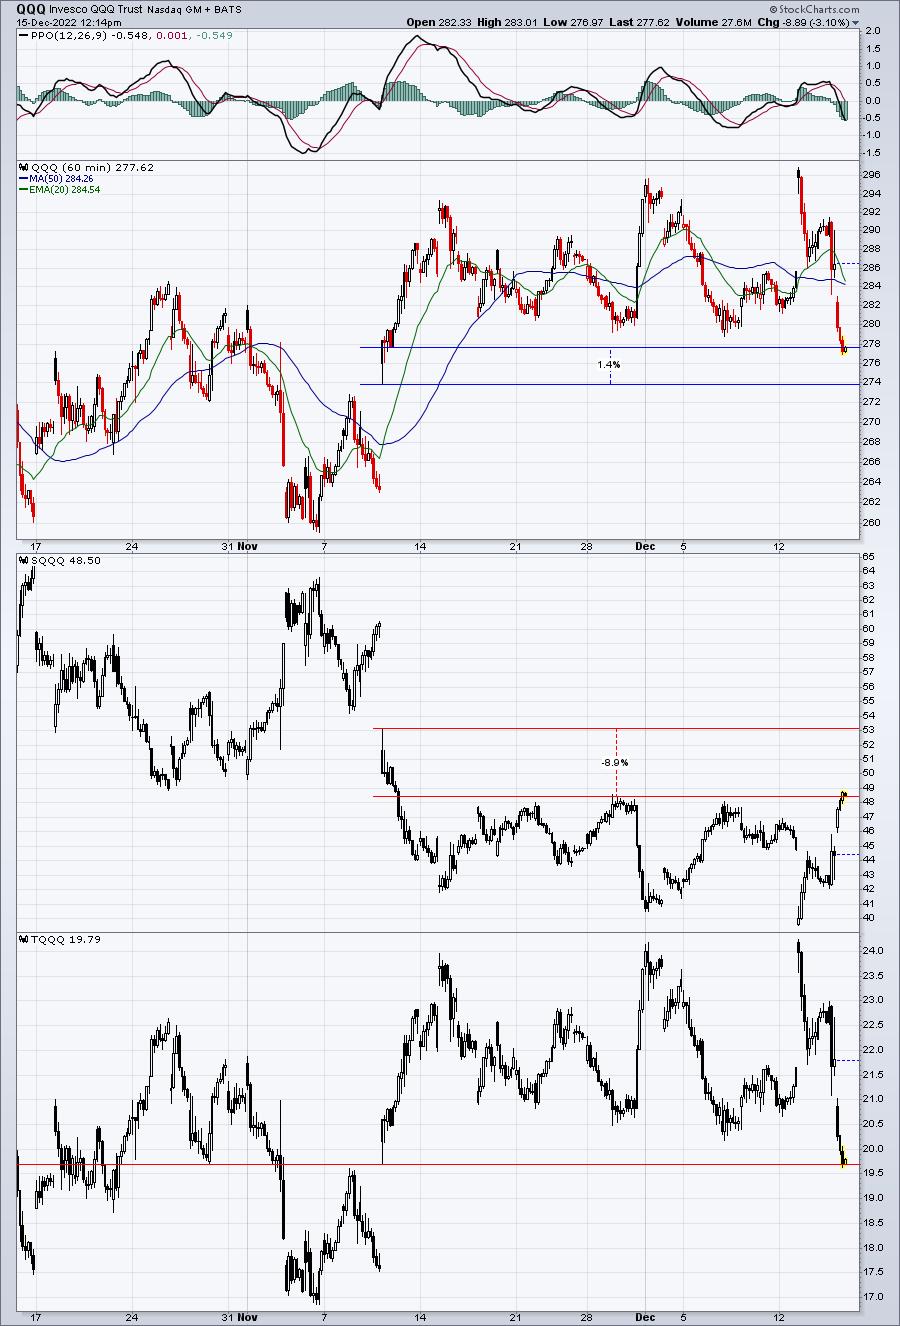
I’ve written many articles and discussed several times that it’s unwise to buy and hold leveraged exchange-traded funds (ETFs) unless you’re at a major support level or you catch an uptrend. Buying and holding through volatile periods results in erosion. In other words, if you hold a leveraged ETF during a period of sideways or consolidating action, there’s a good chance you’ll lose money, even if prices go nowhere. The chart below is of the Invesco QQQ Trust (QQQ), with its corresponding 3x short ETF, the ProShares UltraPro Short QQQ (SQQQ) and 3x long ETF, ProShares UltraPro QQQ (TQQQ). QQQ shows a lot of volatility, both higher and lower, but returns to a level from an earlier period. Look at what happens to the SQQQ and TQQQ in the panels below:
Assume that you bought the QQQ at the low after the October CPI gap up on November 10, 2022. From that day through mid-day December 15, QQQ gained roughly 1.4%. Now, if you were bearish and decided to short the Nasdaq 100 using the 3x leveraged SQQQ, you would expect that you’d be down 4.2% (1.4% move higher in the Nasdaq 100 times 3). But the SQQQ has dropped 8.9%. That’s 4.7% of “erosion” from the back-and-forth action.
Now how about if you wanted to benefit from that move higher in the QQQ by owning the leveraged 3x TQQQ? Well, you should be up 4.2%, right? But look at the chart. TQQQ has been flat since the November 10 low. You’d have been much better off simply buying the QQQ. Does this make sense? It would, if you know how leveraged ETFs work. Leveraged ETFs use derivatives to attempt to match the 3x calculation on a daily basis. They’re not designed to track 3x over any other time period. It’s the volatility and time elapsed that trigger the erosion of these leveraged ETFs. They can perform much better than 3x, however, if you catch a trend and it’s due to the compounding nature of these leveraged gains or losses.
When I trade leveraged ETFs, on the long side, for example, I typically try to catch them when the underlying security tests major support or makes a major breakout from a period of consolidation. I then hold them short-term so long as prices rise. I make sure I keep my stop in place and try to avoid riding them up and down like a roller coaster.
Be sure to join me and several other technical experts from StockCharts.com for our MarketVision 2023 event, to be held on Saturday, January 7, 2023. It’s a FREE virtual event that requires no credit card. You can CLICK HERE to register with your name and email address. This event will most certainly fill up, so register NOW to save your seat!
Happy trading!
Tom


