


You’ve probably heard the adage, “Don’t judge a book by its cover?” Well, it’s tempting to say that when you look at the possible Fed-induced selloff in the stock market. While we’re seeing a lot of negativity, let’s not forget first and foremost that it’s options-expiration week. 24 hours ago, there were millions and millions of net in-the-money call options premium. Not anymore.
The market makers have done it again, managing to wipe out a lot of call premium just when they needed it most.
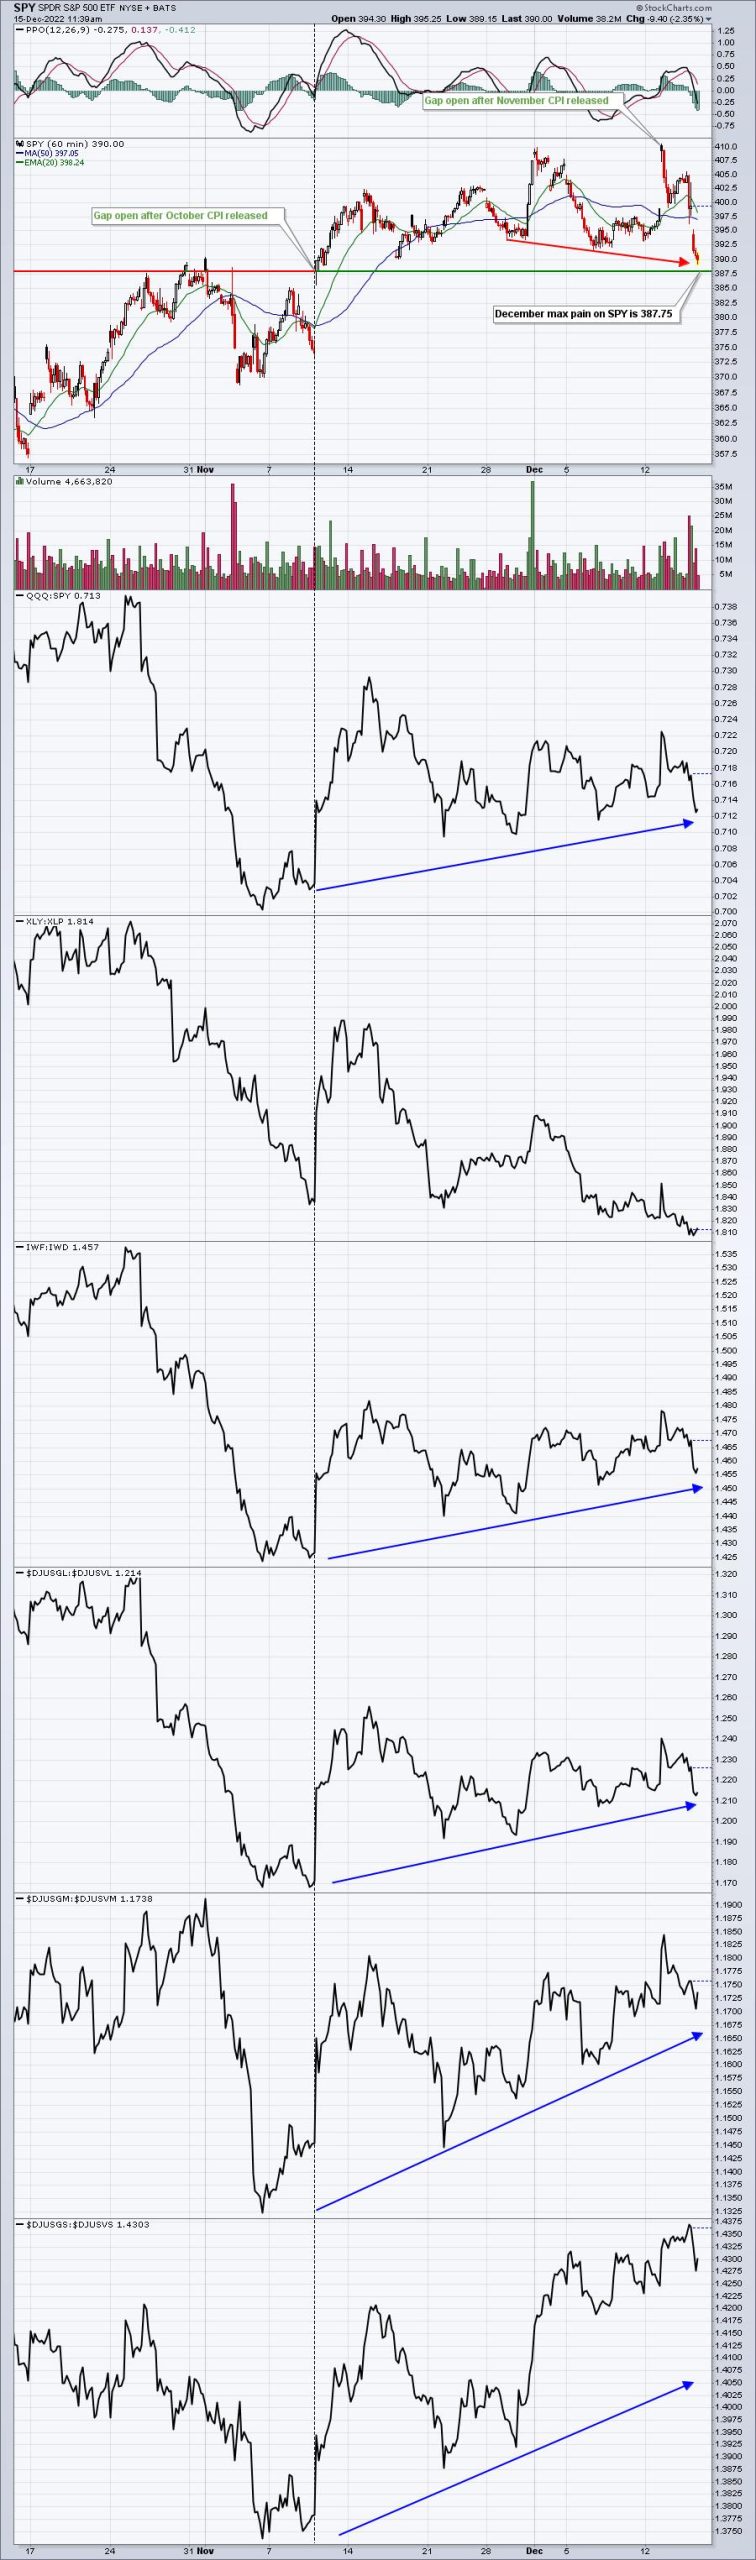
So is the selling the real deal? Probably not. The big Wall Street firms are probably using this latest round of selling to pour into their favorite aggressive growth stocks. Check out the chart of the SPDR S&P 500 ETF (SPY) chart below. Maybe you may have a different interpretation.
CHART 1: ROTATION TO GROWTH STOCKS? Very possible when you look at the activity in the SPY and compare it to the various ratio charts. Chart source: StockCharts.com. For illustrative purposes only.
While the SPY has been selling, money is actually rotating more toward growth vs. value stocks. The one exception is the Consumer Discretionary Select Sector SPDR (XLY): Consumer Staples Select Sector SPDR (XLP), which has continued to march lower because of the relative weakness in Amazon.com (AMZN) and Tesla, Inc. (TSLA). These two stocks account for nearly half of XLY’s performance. All other key growth vs. value ratios have been printing higher lows while the SPY finds lower lows. The black-dotted vertical line separates the data before November 10, 2022, from the period after. This allows us to focus on what has happened since the October inflation data was released.
Earlier this year (Saturday, January 8, 2022), I predicted big trouble ahead, in part due to Wall Street firms repositioning into value stocks (vs. growth) while the indexes were moving to all-time highs. Now the reverse is in place. The SPY is setting new recent lows and challenging the key gap support from November 10, while money is clearly rotating into growth stocks. The bond market is confirming this bullish action as the 10-year U.S. Treasury Yield Index ($TNX) has dropped 88 basis points from 4.33% on October 21 to 3.45% on December 15 morning. Lower interest rates add value to the market caps of growth stocks. We’re not seeing it yet, but Wall Street may be prepping for it.
You won’t want to miss MarketVision 2023, to be held on Saturday, January 7, 2023. It’s a FREE virtual event and will feature the following speakers:
Tom Bowley, Chief Market Strategist, EarningsBeats.comDavid Keller, Chief Market Strategist, StockCharts.comGrayson Roze, Vice President of Operations, StockCharts.comJulius de Kempenaer, Director of Data, StockCharts.com
This event will fill up fast, so be sure to CLICK HERE and register with your name and email address to save your seat. I look forward to seeing you there!!!
Tom


